サポート、レジスタンス、モメンタム指標に基づくマルチタイムフレームトレンドフォロー戦略
作成日:
2024-03-08 17:41:26
最終変更日:
2024-03-08 17:41:26
コピー:
7
クリック数:
739
1
フォロー
1750
フォロワー
戦略概要
この戦略は,サポートレジスタンスレベル,スーパートレンド指標,移動平均などの複数の技術指標を総合的に利用して,複数の時間枠でトレンド方向を総合的に判断し,トレンド追跡システムを実現する.この戦略の主な考えは,まず,枢軸点を利用して,現在の価格のサポートレジスタンス位置を判断し,次にスーパートレンド指標を使用して現在のトレンド方向を判断し,最後に移動平均線フィルターを使用して行情から離れる.同時に,戦略は,取引時間ウィンドウを設定し,最大ポジションを制限するなどのリスク管理をサポートする.
戦略原則
- まず,過去一定周期の最高最低価格に基づいて軸点を計算し,現在の価格のサポートレジスタンス位を得る.
- 超トレンド指数 (Supertrend) を使ってトレンドを判断する.超トレンドは,動的サポート抵抗から計算され,トレンド追跡指標である.
- ATRのストップを使用する. この戦略は,原始的な超トレンドに基づいてATRをストップポイントとして追加した.
- 移動平均線をトレンドフィルターとして使用する.トレンドが上向きで価格が平均線上にあるときのみ多し,トレンドが下向きで価格が平均線下にあるときのみ空しする.
- 取引時間ウィンドウを設定します.特定の時間帯にのみポジションを開設し,重要な時間帯で取引を回避します.
- 多空ポジションはそれぞれ管理される.多頭と空頭の信号はそれぞれ開口ポジションロジックをトリガーする.
全体として,この戦略は,中心軸を支える抵抗,超トレンド方向,均線方向の3つの条件が共鳴するときにポジションを開く.いずれかの条件が無効になる場合は平仓である.これは,トレンドの動きを効果的に捉え,同時にリスクを制御する.
優位分析
- 支柱のレジスタンス位による取引の利点は,市場需要と供給の法則に適合することであり,枢軸は市場の均衡に動的に反応する.
- 超トレンドはトレンドを効果的に捕捉し,タイムリーで止めてくれます. ATRの止まりはリスクをさらに制御します.
- 均線フィルタは逆転取引を回避する. 傾向と均線が共鳴する時に入場すると,勝率が高くなる.
- カスタム取引時間ウィンドウは,開盤と閉盤などの重要な時間点での取引を一定程度に回避します.
- 多頭と空頭シグナルはそれぞれ独立して動作し,同時に多空位を保持し,市場機会をより充分に利用することができる.
リスク分析
- 頻繁に取引するリスク. この戦略は,変動する市場で頻繁に平仓を打つ可能性があり,取引コストが過剰に高まる可能性があります.
- 逆転取引は起こり得る.この戦略は均線フィルターを使用しているものの,均線が大きなトレンドと矛盾している場合,逆転取引は起こりうる.
- パラメータの最適化の問題。戦略には,超トレンドの周期と倍数,平均周期など,多くのパラメータが含まれている。異なるパラメータは,異なる結果が得られ,最適なパラメータの組み合わせをどのように選択するかが課題である。
- 極端な状況では,この戦略が有効に機能しない可能性があります. 暴落,流動性の危機などの極端な状況では,この戦略が有効に機能しない可能性があります.
最適化の方向
- 中長期平均線を導入し,トレンド判断の信頼性を高め,取引の頻度を減らす.
- ブリン帯のような波動性指標の導入は,高波動性市場での取引を減らすことを考えることができる.
- 各パラメータを最適化し,最適なパラメータの組み合わせを見つけ,戦略の安定性を向上させる.
- 極端な状況下ではハードストップを設定し,リスクを制御する.また,価格の飛躍,取引量の激増など,異常な市場の変動の判断を加え,異常なときに取引を減らしたり停止したりすることを考慮することができる.
要約する
この戦略は,サポートレジスタンス,トレンド追跡,運動フィルターなどの複数の技術分析方法を統合して,トレンド状況で効果的に利益を得ることができ,同時に撤回リスクを制御します.その優点は,信号が明確で簡潔で,論理が明確で,中期間に適用されるということです.しかし,この戦略には,頻繁に取引する,パラメータの最適化の難しさ,極端な状況でのリスク管理の不足などの問題があります.将来,より多くの技術指標を導入し,パラメータの最適化,ハードストップの設定,異常状況を判断するなどの方法によりさらに改善することができます.全体的に,この戦略は,より成熟したトレンド追跡戦略であり,適切な最適化と改善の後,健全な取引システムになります.
ストラテジーソースコード
/*backtest
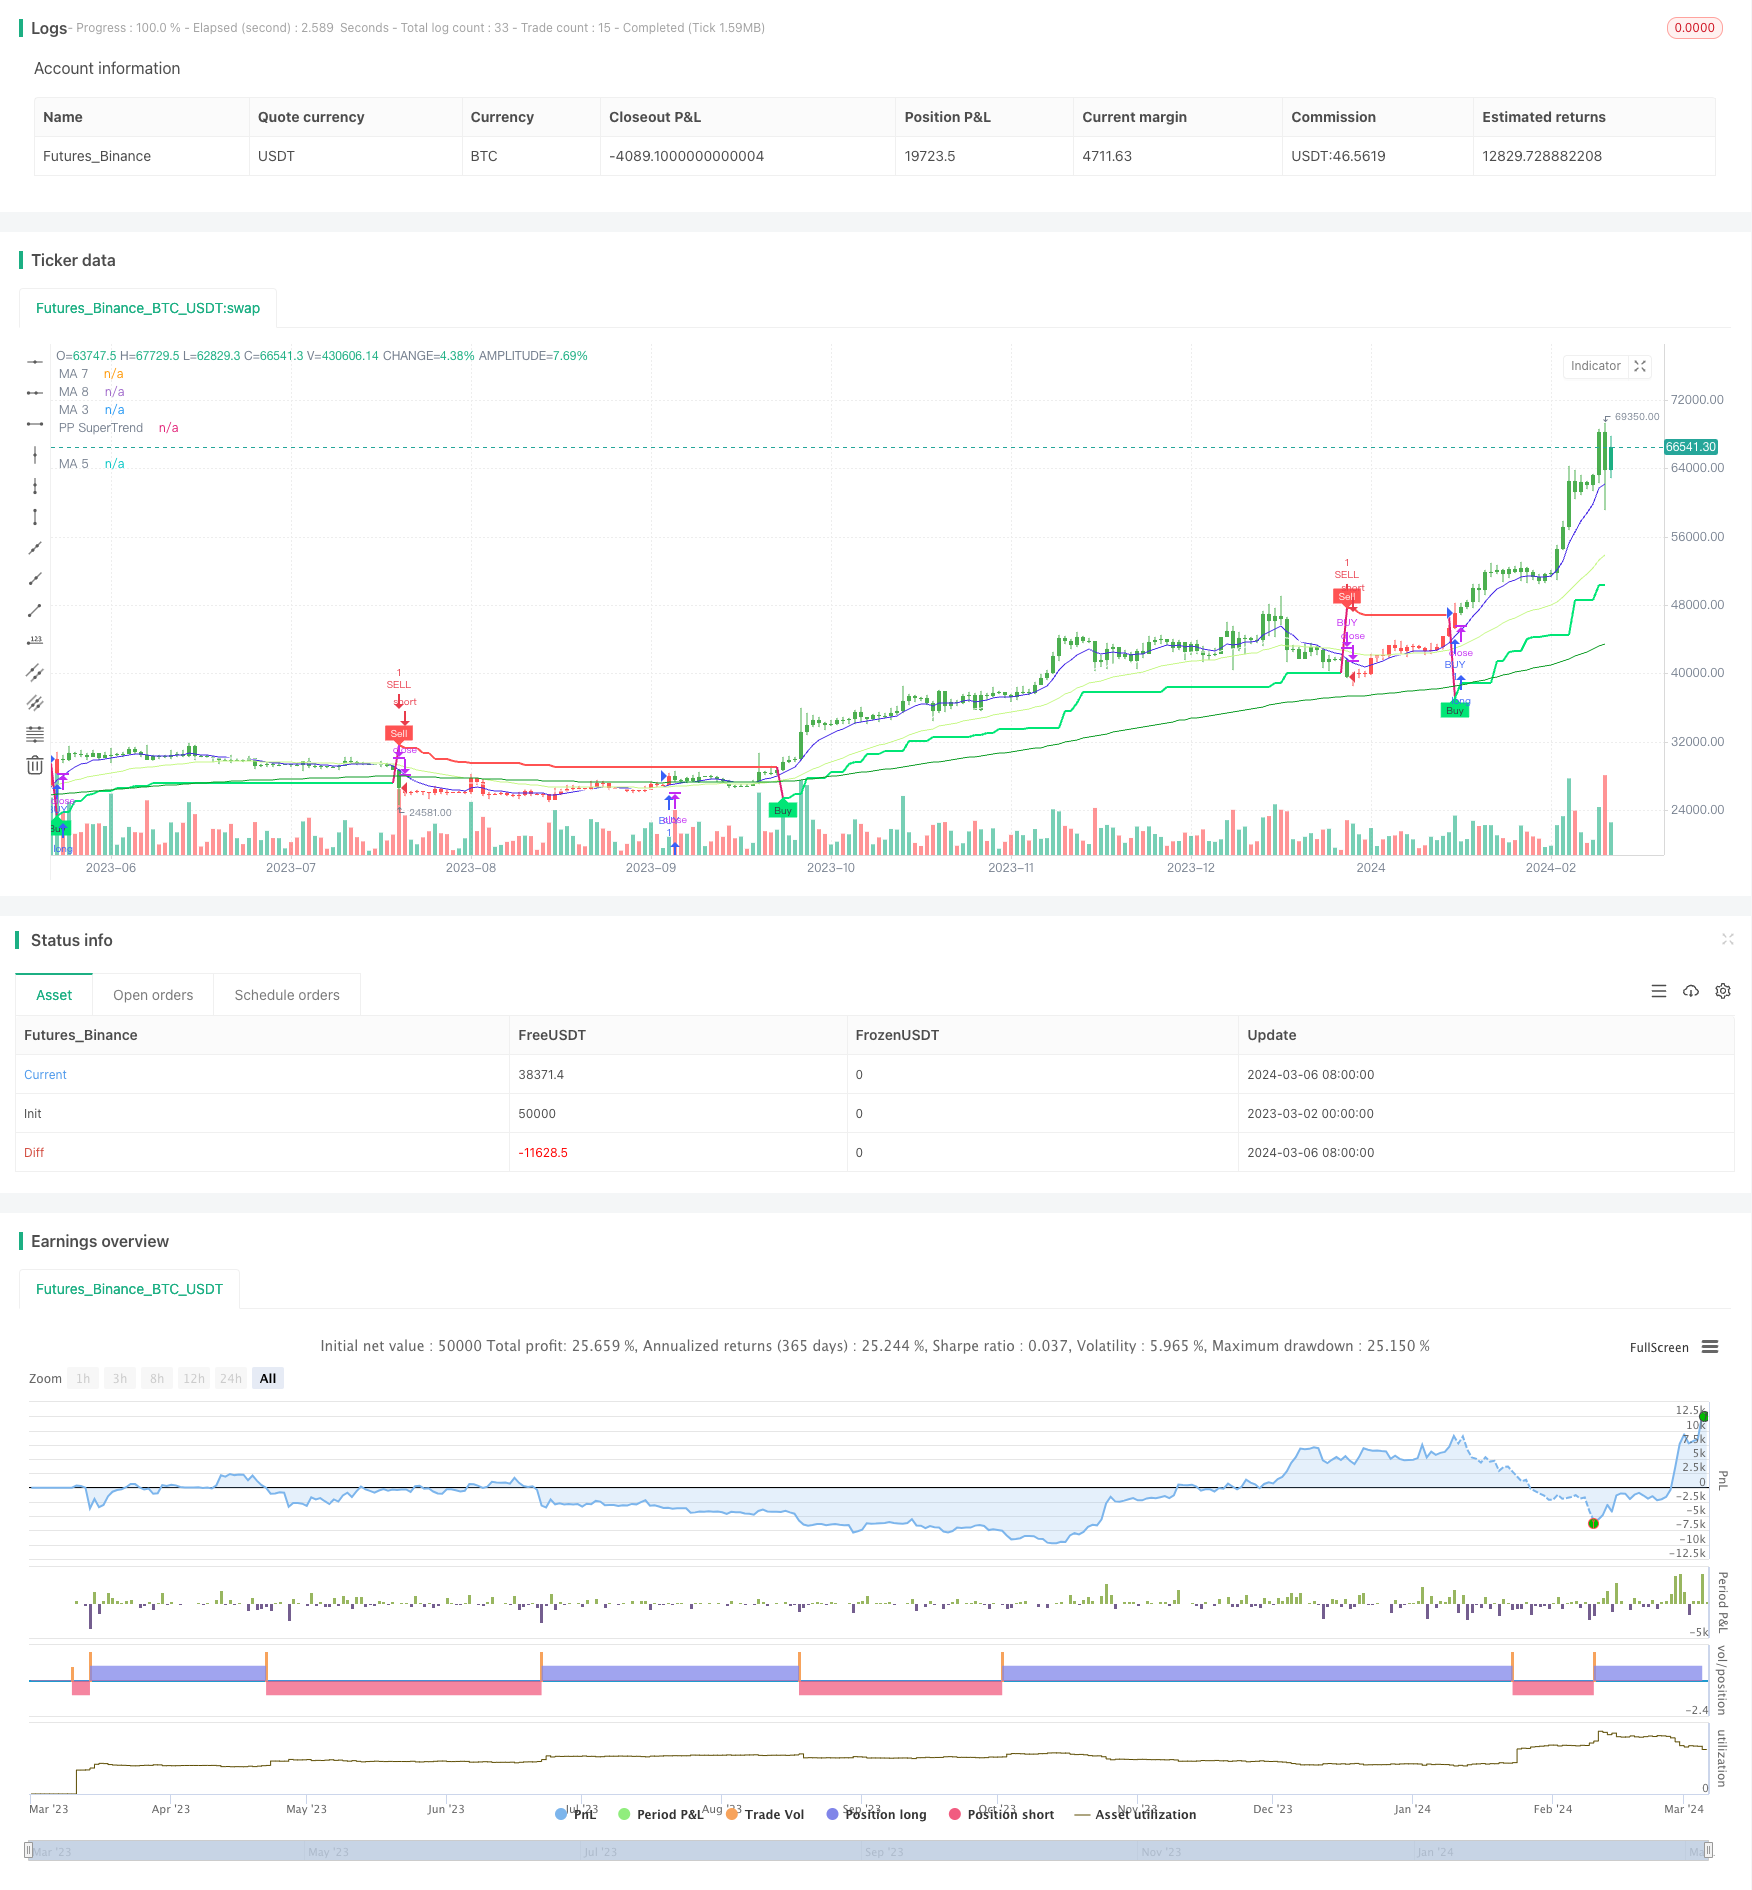
start: 2023-03-02 00:00:00
end: 2024-03-07 00:00:00
period: 1d
basePeriod: 1h
exchanges: [{"eid":"Futures_Binance","currency":"BTC_USDT"}]
*/
//@rpcoelho
// Based on © Julien_Eche "Pivot Point Supertrend" with optional EMAs ploted
//@version=4
strategy("PPS w/ EMAs", overlay=true)
prd = input(defval = 1, title="Pivot Point Period", minval = 1, maxval = 50)
Factor=input(defval = 4, title = "ATR Factor", minval = 1, step = 0.1)
Pd=input(defval = 72, title = "ATR Period", minval=1)
showpivot = input(defval = false, title="Show Pivot Points")
showlabel = input(defval = true, title="Show Buy/Sell Labels")
showcl = input(defval = false, title="Show PP Center Line")
showsr = input(defval = false, title="Show Support/Resistance")
/////////////////////////////////////////////////////////////////////////
// Switch Board
////////////////////////////////////////////////////////////////////////
// Define the switch board title as a label (since grouping is not available)
//switchboard_group = "████ Switch Board (Turn On/Off Overlay Indicators) ████"
//label.new(bar_index, high, switchboard_group, color=color.red)
// Create input controls for EMA and VWAP switches
switch_ema = input(true, title="EMA")
/////////////////////////////////////////////////////////////////////////
// EMA Selection
////////////////////////////////////////////////////////////////////////
ma_function(source, length, type) =>
float ma = na
if type == 'RMA'
ma := rma(source, length)
else if type == 'SMA'
ma := sma(source, length)
else if type == 'EMA'
ma := ema(source, length)
else if type == 'WMA'
ma := wma(source, length)
else if type == 'HMA'
ma := length < 2 ? hma(source, 2) : hma(source, length)
else
ma := vwma(source, length)
ma
// Moving Averages Line Title
//ma_group = "██████████ MAs Line ██████████"
// Inputs for MA 1
len1bool = input(false, title="Show MA 1")
len1 = input(13, title="Length MA 1")
ma_1_type = input("EMA", title="Type MA 1", options=["RMA", "SMA", "EMA", "WMA", "HMA", "VWMA"])
src_ma1 = input(title="MA1 Source", type=input.source, defval=close)
ma_1_colour = input(color.rgb(235, 159, 238), title="Color MA 1")
// Inputs for MA 2
len2bool = input(false, title="Show MA 2")
len2 = input(17, title="Length MA 2")
ma_2_type = input("EMA", title="Type MA 2", options=["RMA", "SMA", "EMA", "WMA", "HMA", "VWMA"])
src_ma2 = input(title="MA2 Source", type=input.source, defval=close)
ma_2_colour = input(color.rgb(230, 241, 65), title="Color MA 2")
// Inputs for MA 3
len3bool = input(true, title="Show MA 3")
len3 = input(34, title="Length MA 3")
ma_3_type = input("EMA", title="Type MA 3", options=["RMA", "SMA", "EMA", "WMA", "HMA", "VWMA"])
src_ma3 = input(title="MA3 Source", type=input.source, defval=close)
ma_3_colour = input(#c7f887, title="Color MA 3")
// Inputs for MA 4
len4bool = input(false, title="Show MA 4")
len4 = input(72, title="Length MA 4")
ma_4_type = input("EMA", title="Type MA 4", options=["RMA", "SMA", "EMA", "WMA", "HMA", "VWMA"])
src_ma4 = input(title="MA4 Source", type=input.source, defval=close)
ma_4_colour = input(#2f6999, title="Color MA 4")
// Inputs for MA 5
len5bool = input(true, title="Show MA 5")
len5 = input(144, title="Length MA 5")
ma_5_type = input("EMA", title="Type MA 5", options=["RMA", "SMA", "EMA", "WMA", "HMA", "VWMA"])
src_ma5 = input(title="MA5 Source", type=input.source, defval=close)
ma_5_colour = input(color.rgb(13, 156, 37), title="Color MA 5")
// Inputs for MA 6
len6bool = input(true, title="Show MA 6")
len6 = input(610, title="Length MA 6")
ma_6_type = input("EMA", title="Type MA 6", options=["RMA", "SMA", "EMA", "WMA", "HMA", "VWMA"])
src_ma6 = input(title="MA6 Source", type=input.source, defval=close)
ma_6_colour = input(color.rgb(173, 161, 152), title="Color MA 6")
// Inputs for MA 7
len7bool = input(true, title="Show MA 7")
len7 = input(8, title="Length MA 7")
ma_7_type = input("EMA", title="Type MA 7", options=["RMA", "SMA", "EMA", "WMA", "HMA", "VWMA"])
src_ma7 = input(title="MA7 Source", type=input.source, defval=close)
ma_7_colour = input(color.rgb(68, 39, 231), title="Color MA 7")
// Inputs for MA 8
len8bool = input(true, title="Show MA 8")
len8 = input(21, title="Length MA 8")
ma_8_type = input("EMA", title="Type MA 8", options=["RMA", "SMA", "EMA", "WMA", "HMA", "VWMA"])
src_ma8 = input(title="MA8 Source", type=input.source, defval=close)
ma_8_colour = input(color.white, title="Color MA 8")
ema1 = security(syminfo.tickerid, timeframe.period, ma_function(src_ma1, len1, ma_1_type))
ema2 = security(syminfo.tickerid, timeframe.period, ma_function(src_ma2, len2, ma_2_type))
ema3 = security(syminfo.tickerid, timeframe.period, ma_function(src_ma3, len3, ma_3_type))
ema4 = security(syminfo.tickerid, timeframe.period, ma_function(src_ma4, len4, ma_4_type))
ema5 = security(syminfo.tickerid, timeframe.period, ma_function(src_ma5, len5, ma_5_type))
ema6 = security(syminfo.tickerid, timeframe.period, ma_function(src_ma6, len6, ma_6_type))
ema7 = security(syminfo.tickerid, timeframe.period, ma_function(src_ma7, len7, ma_7_type))
ema8 = security(syminfo.tickerid, timeframe.period, ma_function(src_ma8, len8, ma_8_type))
plot(len1bool and switch_ema ? ema1:na, color=ma_1_colour, linewidth=1, title='MA 1')
plot(len2bool and switch_ema? ema2:na, color=ma_2_colour, linewidth=1, title='MA 2')
plot(len3bool and switch_ema? ema3:na, color=ma_3_colour, linewidth=1, title='MA 3')
plot(len4bool and switch_ema? ema4:na, color=ma_4_colour, linewidth=1, title='MA 4')
plot(len5bool and switch_ema? ema5:na, color=ma_5_colour, linewidth=1, title='MA 5')
plot(len6bool and switch_ema? ema6:na, color=ma_6_colour, linewidth=2, title='MA 6')
plot(len7bool and switch_ema? ema7:na, color=ma_7_colour, linewidth=1, title='MA 7')
plot(len8bool and switch_ema? ema8:na, color=ma_8_colour, linewidth=1, title='MA 8')
// get Pivot High/Low
float ph = pivothigh(prd, prd)
float pl = pivotlow(prd, prd)
// drawl Pivot Points if "showpivot" is enabled
plotshape(ph and showpivot, text="H", style=shape.labeldown, color=na, textcolor=color.red, location=location.abovebar, transp=0, offset = -prd)
plotshape(pl and showpivot, text="L", style=shape.labeldown, color=na, textcolor=color.lime, location=location.belowbar, transp=0, offset = -prd)
// calculate the Center line using pivot points
var float center = na
float lastpp = ph ? ph : pl ? pl : na
if lastpp
if na(center)
center := lastpp
else
//weighted calculation
center := (center * 2 + lastpp) / 3
// upper/lower bands calculation
Up = center - (Factor * atr(Pd))
Dn = center + (Factor * atr(Pd))
// get the trend
float TUp = na
float TDown = na
Trend = 0
TUp := close[1] > TUp[1] ? max(Up, TUp[1]) : Up
TDown := close[1] < TDown[1] ? min(Dn, TDown[1]) : Dn
Trend := close > TDown[1] ? 1: close < TUp[1]? -1: nz(Trend[1], 1)
Trailingsl = Trend == 1 ? TUp : TDown
// plot the trend
linecolor = Trend == 1 and nz(Trend[1]) == 1 ? color.lime : Trend == -1 and nz(Trend[1]) == -1 ? color.red : na
plot(Trailingsl, color = linecolor , linewidth = 2, title = "PP SuperTrend")
plot(showcl ? center : na, color = showcl ? center < hl2 ? color.blue : color.red : na)
// check and plot the signals
bsignal = Trend == 1 and Trend[1] == -1
ssignal = Trend == -1 and Trend[1] == 1
plotshape(bsignal and showlabel ? Trailingsl : na, title="Buy", text="Buy", location = location.absolute, style = shape.labelup, size = size.tiny, color = color.lime, textcolor = color.black, transp = 0)
plotshape(ssignal and showlabel ? Trailingsl : na, title="Sell", text="Sell", location = location.absolute, style = shape.labeldown, size = size.tiny, color = color.red, textcolor = color.white, transp = 0)
//get S/R levels using Pivot Points
float resistance = na
float support = na
support := pl ? pl : support[1]
resistance := ph ? ph : resistance[1]
// if enabled then show S/R levels
plot(showsr and support ? support : na, color = showsr and support ? color.lime : na, style = plot.style_circles, offset = -prd)
plot(showsr and resistance ? resistance : na, color = showsr and resistance ? color.red : na, style = plot.style_circles, offset = -prd)
// Trend Filter from SuperTrend Long Strategy
Periods = input(title="ATR Period", type=input.integer, defval=3)
src = input(hlc3, title="Source")
Multiplier = input(title="ATR Multiplier", type=input.float, step=0.1, defval=4.0)
changeATR = input(title="Change ATR Calculation Method ?", type=input.bool, defval=true)
// Combine the SuperTrend calculations
atr2 = sma(tr, Periods)
atr = changeATR ? atr(Periods) : atr2
up = src - (Multiplier * atr)
up1 = nz(up[1], up)
up := close[1] > up1 ? max(up, up1) : up
dn = src + (Multiplier * atr)
dn1 = nz(dn[1], dn)
dn := close[1] < dn1 ? min(dn, dn1) : dn
trend = 1
trend := nz(trend[1], trend)
trend := trend == -1 and close > dn1 ? 1 : trend == 1 and close < up1 ? -1 : trend
// Moving Average as Trend Filter
periodes_ma = input(title="Moving Average Period", type=input.integer, defval=20)
src_ma = input(title="Moving Average Source", type=input.source, defval=close)
ma = sma(src_ma, periodes_ma)
// Strategy Entry Conditions
FromMonth = input(defval = 1, title = "From Month", minval = 1, maxval = 12)
FromDay = input(defval = 1, title = "From Day", minval = 1, maxval = 31)
FromYear = input(defval = 2017, title = "From Year", minval = 999)
ToMonth = input(defval = 1, title = "To Month", minval = 1, maxval = 12)
ToDay = input(defval = 1, title = "To Day", minval = 1, maxval = 31)
ToYear = input(defval = 9999, title = "To Year", minval = 999)
start = timestamp(FromYear, FromMonth, FromDay, 00, 00)
finish = timestamp(ToYear, ToMonth, ToDay, 23, 59)
window() => true
// Combined entry conditions
longCondition = (trend == 1 and trend[1] == -1 and close > ma) or (bsignal and window())
shortCondition = (trend == -1 and trend[1] == 1 and close < ma) or (ssignal and window())
if (longCondition)
strategy.entry("BUY", strategy.long)
if (shortCondition)
strategy.close("BUY")
strategy.entry("SELL", strategy.short)
buy1 = barssince((trend == 1 and trend[1] == -1 and close > ma) or (bsignal and window()))
sell1 = barssince((trend == -1 and trend[1] == 1 and close < ma) or (ssignal and window()))
color1 = buy1[1] < sell1[1] ? color.green : buy1[1] > sell1[1] ? color.red : na
barcolor(color1)