二重移動平均クロスオーバーに基づく取引戦略

概要
移動平均線交差策略は,移動平均線交差を2つベースにした取引策である.この策略は,市場の動量の変化を捉えるために,高速移動平均線 (快線) と遅い移動平均線 (遅い線) を使用する.高速線が,下方から慢線を横切るとき,多信号を生成し,高速線が,上方から下方から慢線を横切るとき,空信号を生成する.この策略は,トレンドの継続条件,ストップとストップを考慮しながら,リスクを制御し,利益を最適化する.
戦略原則
この戦略の核心原則は,二つの異なる周期の指数移動平均 ((EMA) を利用して市場の傾向と動力を判断することである.具体的ステップは以下の通りである.
- 計算速度のEMA (この例では9日) と遅いEMA (この例では21日) を計算する.
- 速速EMAが下方向から遅速EMAを横切るときは多做信号を生成する.逆に,速速EMAが上方向から下方向から遅速EMAを横切るときは空き信号を生成する.
- トレンドが継続していることを確認するために,戦略は,ポジションの条件を設定します. ポジションを多めにすると,急速EMAをゆっくりEMA上,そしてクローズアップ価格を迅速EMA上要求します. ポジションを空白にすると,急速EMAをゆっくりEMA下,そしてクローズアップ価格を迅速EMA下を要求します.
- リスクをコントロールするために,戦略は平均実際の波動範囲 ((ATR) を使って市場の波動性を判断し,急速なEMAと遅いEMAの差がATRより小さいときは,戦略は新しいポジションを開設しない.
- 戦略は,固定パーセントの方法でリスク制御を行うため,同時にもストップ・ローズ ((1%) とストップ・ストップ ((2%) を設定した.
上述の原則により,この戦略は,トレンドの持続性,市場の波動性,リスク管理などの要因を考慮しながら,市場動向と動力の変化に基づいて取引決定を行うことができます.
優位分析
動量均線交差策には以下の利点がある.
- トレンド追跡: 平均線をゆっくりと交差させることで,戦略は市場トレンドの変化をタイムリーに捉え,異なる市場環境に適応します.
- シンプルで使いやすい:戦略の論理が明確で,価格と平均線指標のみに依存し,理解し,実行しやすい.
- リスク管理: ストップ・ロズとストップ・ストップを設定し,単一取引のリスクの限界を固定した割合で管理する.
- トレンド確認:戦略は均線交差を考慮するだけでなく,ポジション開設時にトレンドの継続性を確保するためにトレンド継続条件を導入します.
- 波動性フィルター: 平均線差とATRを比較することで,市場波動が少ないときにポジションを開くのを避ける戦略,取引頻度とリスクを減らす.
リスク分析
動量均線交差策には利点があるものの,いくつかのリスクがあります.
- 遅延リスク:平均線は遅滞の指標で,トレンドが逆転した後で信号が発生し,最適な入場タイミングを逃すか,より大きな撤退を耐えることになる.
- 振動市場リスク:振動市場では,急激な平均線が頻繁に交差し,複数の偽信号を生じ,頻繁な取引と損失を引き起こす.
- パラメータリスク:戦略のパフォーマンスは平均線周期と止損停止の設定に依存し,異なるパラメータは異なる結果をもたらす可能性があります.
- 黒天<unk>のリスク:戦略は歴史的なデータに基づいているため,極端な市場イベントや異常な波動に対応できず,重大な損失を招く可能性があります.
これらのリスクに対処するために,以下の方法が考えられます.
- 価格行動,取引量などの他の指標または信号と組み合わせて,信号の信頼性を高める.
- 振動市場では,ATRやADXのようなフィルタリング機構を導入し,頻繁に取引を避ける.
- パラメータを最適化してテストし,歴史的に安定したパラメータの組み合わせを選択します.
- ポジション管理,総損失の停止など,合理的なリスク管理策を設定し,極端な市場状況に対応する.
最適化の方向
動量均線交差戦略のパフォーマンスをさらに向上させるために,以下の最適化方向を考慮することができます.
- ダイナミックパラメータ最適化:市場状況の動向に応じて,平均線周期とストップストップパラメータを調整して,異なる市場リズムと変動率に対応します. これにより,戦略の適応性と安定性を向上させることができます.
- 多時間枠分析:日線や時線などの異なる時間枠の均線信号を組み合わせて,より包括的なトレンド判断を得,異なる時間枠の信号強度に応じてポジションを分配する.
- 他の技術指標を組み合わせる:MACD,RSIなどの他の技術指標を導入し,より多くの取引信号の検証を提供し,信号の信頼性を向上させる.
- リスク管理の最適化:資金配置の最適化と撤回リスクの制御のために,ケリー公式やダイナミックポジション管理などのより高度なリスク管理方法を採用する.
- 機械学習最適化: 遺伝的アルゴリズムやニューラルネットワークなどの機械学習アルゴリズムを適用して,戦略パラメータと論理を最適化し,最適なパラメータ組み合わせと取引ルールを探す.
上述の最適化方向によって,動量均線交差戦略は,原有優位性の維持に基づいて,適応性,安定性,収益の可能性を向上させ,異なる市場環境の課題によりうまく対応することができる.
要約する
動的均線交差策略は,市場動向と動的変化を捕捉するために,迅速かつ効率的な取引策略である.この戦略は,トレンド追跡,使いやすさ,リスク管理などの利点を持ち,傾向の持続性と市場の変動性も考慮する.しかし,この戦略は,遅延リスク,振動市場リスク,参数リスク,ブラック天気リスクなどの課題にも直面する.これらのリスクに対応し,さらに戦略のパフォーマンスを向上させるために,ダイナミックパラメータ最適化,マルチタイムフレーム分析,他の技術指標の組み合わせ,リスク管理の最適化マシンと学習の最適化方向を考慮することができます.
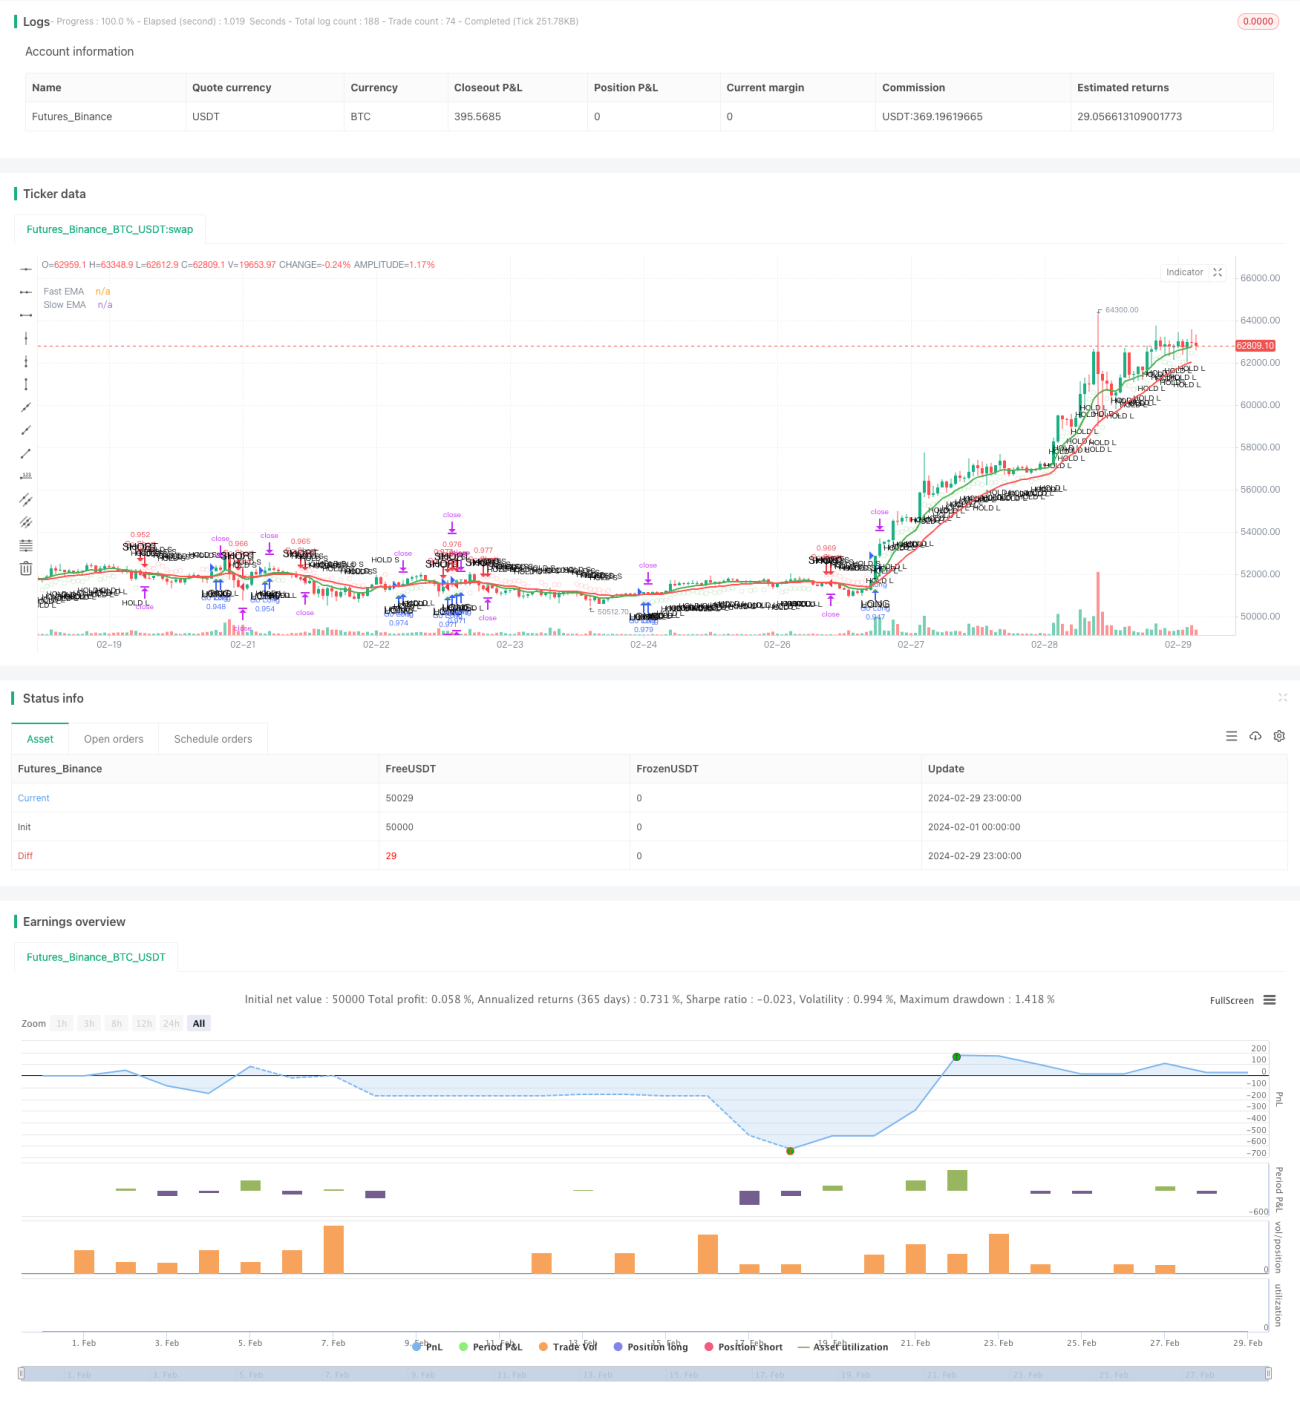
/*backtest
start: 2024-02-01 00:00:00
end: 2024-02-29 23:59:59
period: 1h
basePeriod: 15m
exchanges: [{"eid":"Futures_Binance","currency":"BTC_USDT"}]
*/

//@version=4
strategy("Enhanced Momentum Bot", shorttitle="EMB", overlay=true, default_qty_type=strategy.percent_of_equity, default_qty_value=100)

// Define the Exponential Moving Averages (EMA)- 1