MACD、ADX、EMA200に基づくマルチタイムフレームトレンド取引戦略

1
Follow
1782
Followers
概要
この戦略は,MACD,ADX,EMA200指標をベースに,現在の市場動向と動力を判断し,複数の時間枠でトレンド取引を行う.戦略の主な考えは,MACD指標を使用して市場動向を判断し,ADX指標は,トレンドの強さを確認し,EMA200をトレンドフィルタ条件として,より多くの取引機会とより良い利益リスク比率を得るために複数の時間枠で取引を行うことである.
戦略原則
- 200日指数移動平均 ((EMA200) を計算し,トレンドフィルター条件として使う.
- MACD線,信号線,柱状図を含む MACD指標を計算し,市場動向を判断する.
- 実際の変動率 ((ATR) と方向運動指標 ((ADX) を計算し,トレンドの強さを確認する.
- 多頭入場条件:閉盘価格はEMA200上,MACD線は信号線上,0以下,ADXは25以上である.
- 空頭入場条件:閉盤価格はEMA200以下,MACD線は信号線以下で0以上,ADXは25以上である.
- ATRを使用して,止損と停止距離を計算し,止損設定は1%で,停止設定は1.5%である.
- 多頭条件が満たされたとき,停止単数と限値単数で多行を行う.空頭条件が満たされたとき,停止単数と限値単数で空行を行う.
- 15分,30分,1時間など,異なる時間枠で戦略をテストし,最適な取引時間枠を見つけます.
優位分析
- 複数の指標を組み合わせて取引決定を行うことで,戦略の信頼性と安定性を高めることができます.
- 複数の時間枠で取引することで,さまざまなレベルのトレンドを捉え,より多くの取引機会を得ることができます.
- ATRを使用して,ストップとストップ距離を計算し,ポジションを動的に調整し,リスクを制御できます.
- ストップ・ロズとストップ・ストップの設定は合理的で,戦略の利益リスク比率を向上させるのに役立ちます.
- コード構造は明確で,理解し,最適化することが容易です.
リスク分析
- 戦略はトレンド市場に依存し,波動的な市場ではうまくいかない可能性があります.
- 複数の指標のパラメータ設定は,異なる市場と資産に合わせて最適化する必要がある場合があり,そうでなければ,戦略の不良なパフォーマンスを引き起こす可能性があります.
- ストップ・ロズとストップ・ストップの設定は固定であり,市場の変化に適応できず,損失を増加させ,利益を減少させる可能性があります.
- 複数の時間枠での取引は,取引頻度が増加し,取引コストが増加する可能性があります.
解決策は
- 適応性パラメータの最適化を導入し,市場の変化に応じて指標パラメータを自動的に調整する.
- ストップとストップを動的に調整する.例えば,追跡ストップまたは変化ストップを使用する.
- 取引コストを考慮し,最適の時間枠と取引頻度を選択します.
最適化の方向
- ブリン帯,均線システムなどの他のトレンド確認指標を導入し,トレンド判断の正確性を向上させる.
- 動的ストップストップまたは波動率ベースのストップストップなどの停止と停止設定を最適化します.
- 取引量,市場情緒などのフィルタリング条件を追加して信号の質を向上させる.
- 異なる市場と資産のパラメータを最適化して,最適なパラメータの組み合わせを見つけます.
- 機械学習アルゴリズムを導入し,市場の変化に対応し,戦略の適応性や安定性を向上させる.
戦略の優化により,戦略の効率性や収益性が向上し,異なる市場環境に適応できる.
要約する
この戦略は,MACD,ADX,EMA200などの指標を組み合わせて,複数の時間枠でトレンド取引を行うことで,一定の優位性と実用性を有している.戦略の鍵は,トレンド判断とトレンド強さの確認であり,複数の指標の共同作用により,トレンドの機会をよりうまく捉えることができる.同時に,戦略は,固定ストップストップを使用し,リスクを制御するのに役立ちます.しかし,戦略にはいくつかの限界があります.
Source
Pine
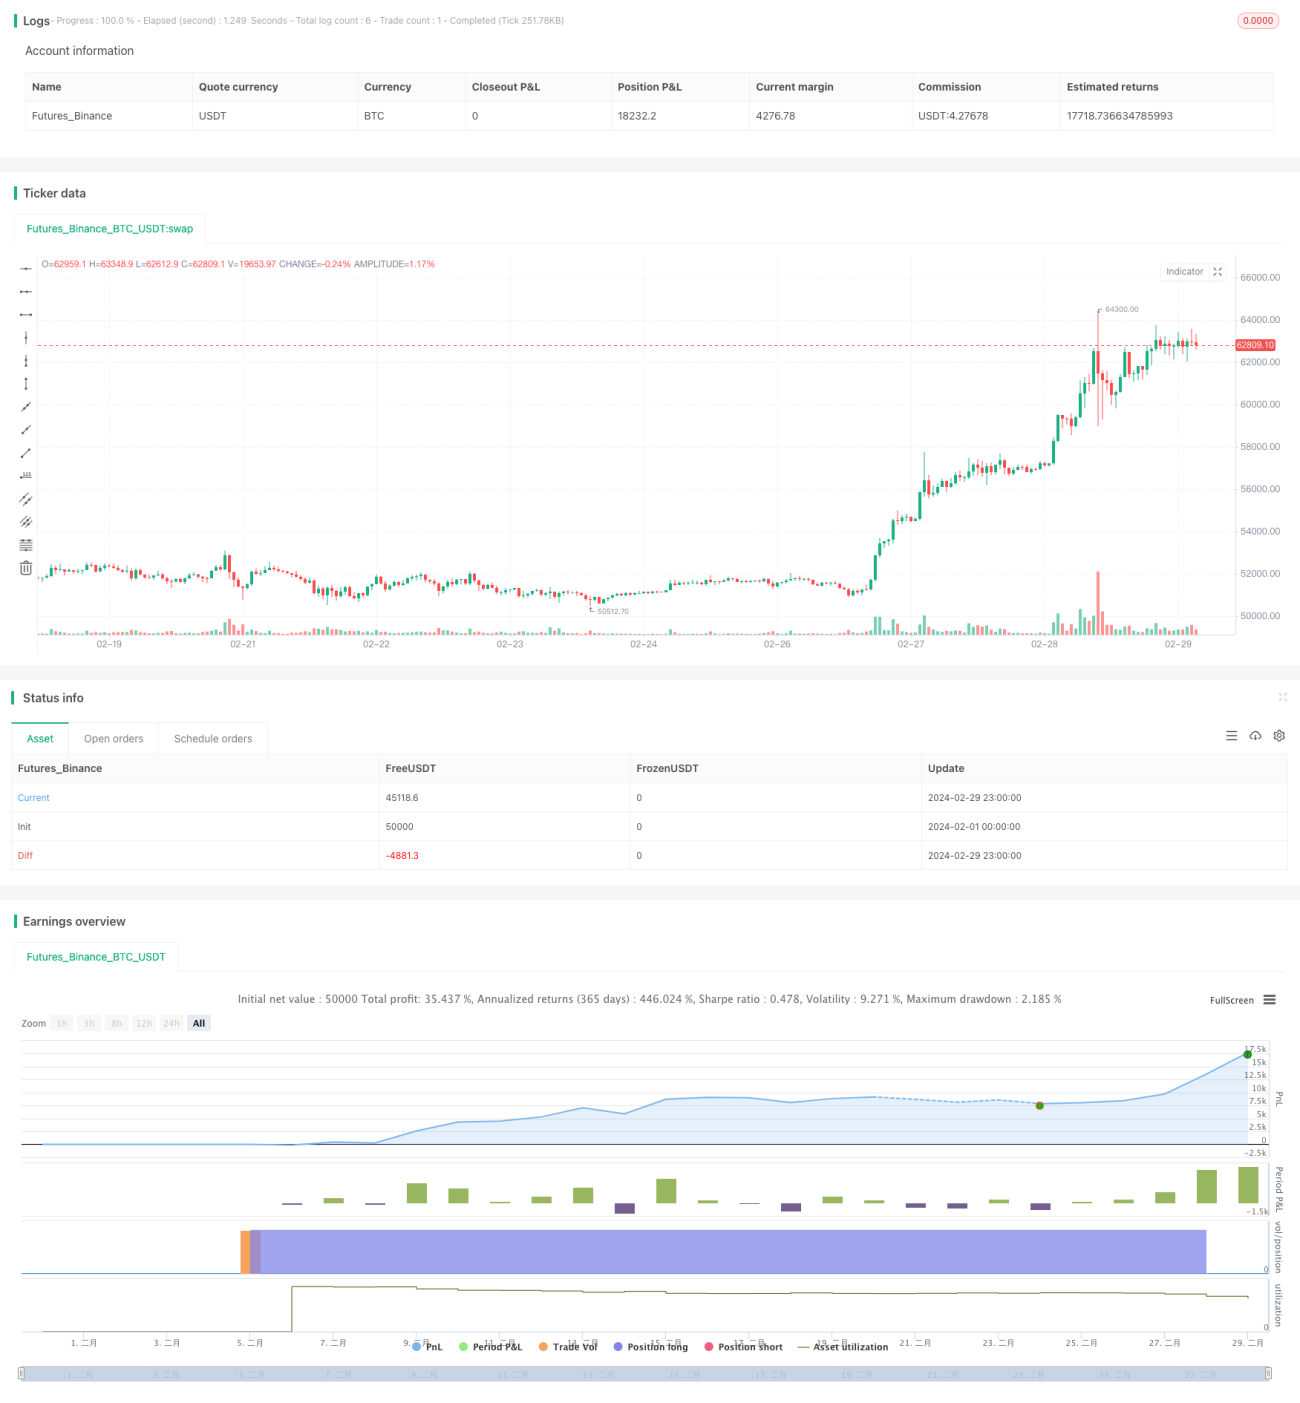
/*backtest
start: 2024-02-01 00:00:00
end: 2024-02-29 23:59:59
period: 1h
basePeriod: 15m
exchanges: [{"eid":"Futures_Binance","currency":"BTC_USDT"}]
*/

// This Pine Script™ code is subject to the terms of the Mozilla Public License 2.0 at https://mozilla.org/MPL/2.0/
// © colemanrumsey

//@version=5Related strategies
Comment
All comments (0)
No data
- 1