トレンドブレイクアウト戦略

1
Follow
1782
Followers
概要
これはATR指標と閉盤価格を使用してトレンドブレイクを捕捉する量化取引戦略である.この戦略は,動的に上下トレンドラインを計算してトレンドの方向を判断し,閉盤価格がトレンドラインを突破すると取引シグナルを生成する.この戦略は,同時にストップとターゲット価格を設定し,変動に応じて移動ストップを行う.
戦略原則
- ATR信号を計算する: atr_signal = atr ((atr_period)
- 傾向線を計算すると:
- 下のトレンドライン: lower_trend = low - atr_mult*atr_signal
- 上向きトレンドライン: upper_trend = high + atr_mult*atr_signal
- 動的にトレンドラインを調整し,トレンドラインの突破は変わらない,または最新の値に更新
- トレンドラインの色付けは,トレンドの方向を判断するために,閉店価格とトレンドラインの相対的な位置に基づいて行われます.
- 取引のシグナルを生成する:
- 株価が上昇し,株価が上昇し,株価が上昇した.
- 空売りシグナル:現在無ポジションで,閉店価格が下トレンドラインを突破している
- ストップとターゲットの設定:
- ストップ: 最新取引価格 ± 突破時のATR変動幅のファクター
- ターゲット価格: 最新取引価格 ± ストップ・ローズ幅 * 利益・損失比rr
- 移動停止:
- 多頭ストップ: 最上位トレンドライン
- 空頭ストップ: 最下位トレンドライン
優位分析
- 変動率の動的調整によるトレンドライン,異なる市場状況に対応
- トレンドラインは,トレンドを識別するために,方向性のある色のマーカーを持っています.
- ATRを波動率の指標として使用し,合理的なストップとターゲット価格を設定する.
- モバイル・ストップ・ローズ機能で,利潤を保証しながら,撤収を最小限に抑える
- 参数化度が高い,異なる品種と周期に適応
リスク分析
- トレンドブレイク戦略は,波動的な市場では,過剰なシグナルを生じやすく,損失を招く.
- ATRパラメータの不適切な選択により,トレンドラインが過度に敏感または鈍化し,信号の質に影響を与える可能性があります.
- 固定利益比率は,異なる市場特性に適応できない
- 移動ストップはトレンドを逃す可能性が高い
解決策は
- トレンドフィルターまたは震動指数による補助判断を導入し,震動市場の損失を避ける
- 品種と周期特性に応じてATRパラメータを最適化
- 利回り比率と移動ストップロジックの最適化,戦略利回りリスク比率の向上
- トレンド認識と組み合わせることで,移動ストップを改善し,より多くのトレンドの利得を捉えます.
最適化の方向
- 多時間周期を組み合わせ,大周期でトレンドを識別し,小周期でシグナルをトリガーする
- トレンドラインの突破前に量値指標の検証を加え,信号の有効性を向上させる
- ポジション管理の最適化,波段操作の追加
- ストップ・ローズ比のパラメータ最適化
- モバイル・ストップロジックの改善,トレンドの初期ストップを減らす
多時間周期は騒音をフィルターし,トレンド把握をより安定させるのに役立ちます. 突破前の量指数検証は偽の信号を<unk>除します. ポジション管理の最適化は資金利用の効率性を向上させます. 止損と<unk>損比のパラメータの最適化は戦略の収益リスク比率を改善します. 移動止損論理の改善は,引き下げを制御しながら,より多くのトレンド利益を得ることができます.
要約する
この戦略は,ATRを波動率として測定し,動的にトレンドライン位置を調整し,トレンド突破状況を捕捉する.合理的にストップと利益目標を設定し,移動ストップを活用して利益をロックする.パラメータは調整可能で,適応性が強い.しかし,トレンド突破戦略は,揺れ動いている状況の影響を受けやすいため,さらなる最適化と改善が必要である.多周期,シグナル選択,ポジション管理の最適化,参数優位を求めるなどの方法で戦略のパフォーマンスと安定性を向上させることができる.
Source
Pine
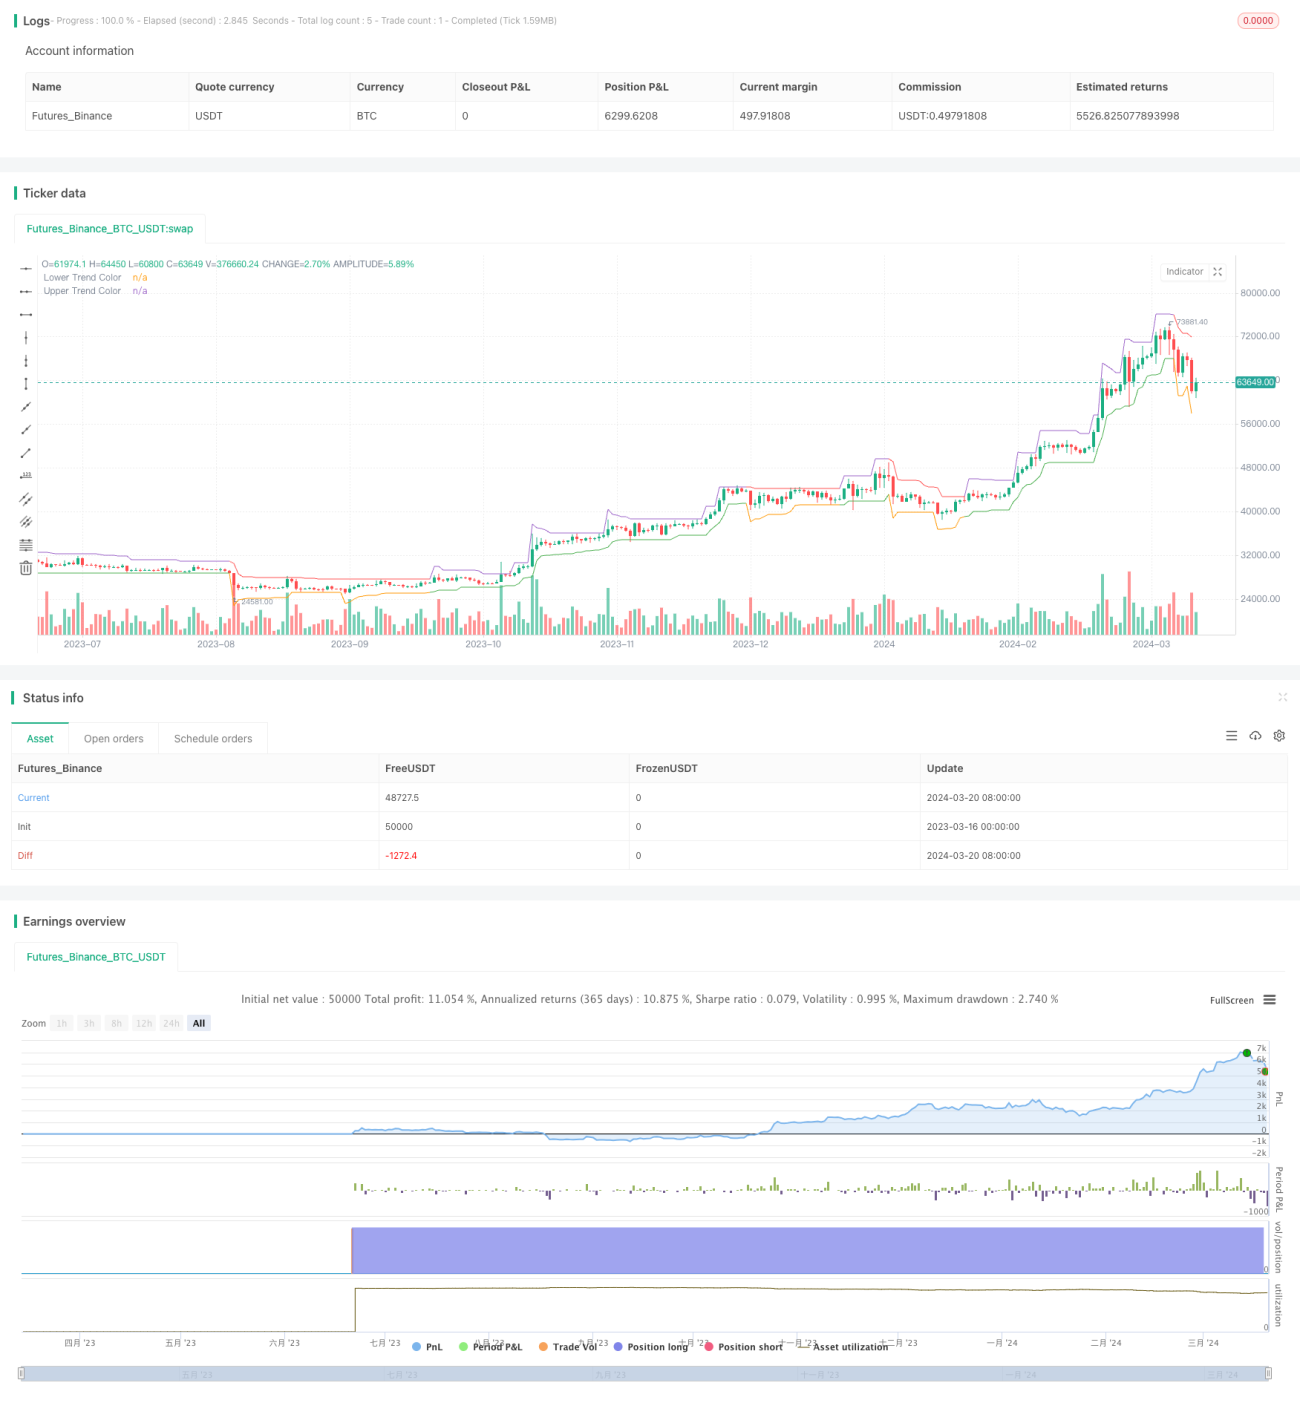
/*backtest
start: 2023-03-16 00:00:00
end: 2024-03-21 00:00:00
period: 1d
basePeriod: 1h
exchanges: [{"eid":"Futures_Binance","currency":"BTC_USDT"}]
*/

//@version=4
strategy(title = "Claw-Pattern", overlay=true, calc_on_every_tick=true, default_qty_type= strategy.percent_of_equity,default_qty_value=10, currency="USD")
//Developer: Trading Strategy Guides
//Creator: Trading Strategy GuidesStrategy parameters
Related strategies
Comment
All comments (0)
No data
- 1