RSIストップトレーリング取引戦略

1
Follow
1782
Followers
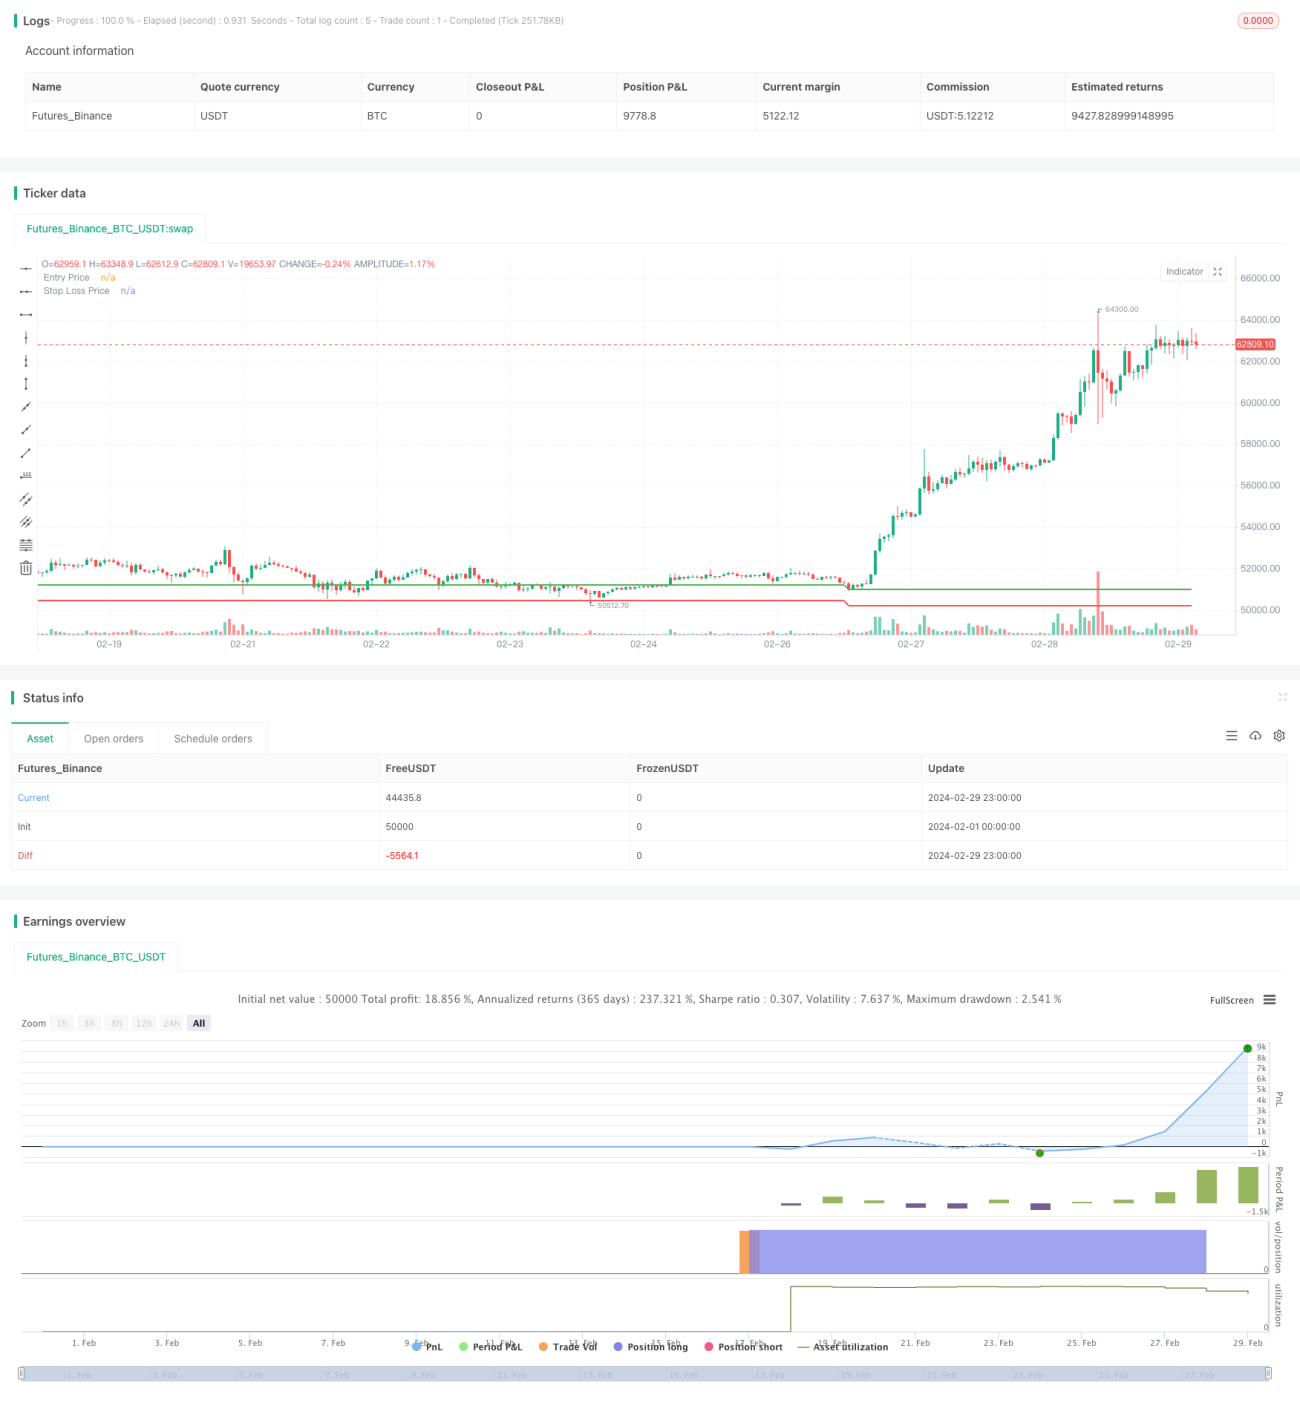
概要
この戦略は,相対的に強い指数 ((RSI) の指標を使用して,市場の超売り状況を判断し,RSIが30未満のときにポジションを多く開設し,同時に,開設価格の98.5%をストップ・ロスの価格に設定する.この戦略の主な考え方は,市場が超売りシグナルが発生したときに入場し,同時に,リスクを厳格に制御し,価格がストップ・ロスの価格を下回るとすぐに,ポジションを停止する.
戦略原則
- RSIは14のK線を基に計算する.
- RSIが30未満の場合は,オーバーセール信号を発し,その時点でポジションを開き,多額の取引を行う.
- ポジション開設と同時に,開設価格を記録し,開設価格とストップ損失の比率 ((1.5%) によってストップ損失価格を計算する.
- 価格がストップ・損失価格を下回ると,即座に平仓をストップする.
- ポジションを平らにした後,ポジション開設価格とストップ価格を再設定し,次のポジション開設機会を待つ.
戦略的優位性
- シンプルで分かりやすく,論理が明確で,初心者向けに学習・使用が便利です.
- リスクを厳格に管理し,ストップ・ロスの価格を設定し,ストップ・ロスの価格に触れたら即座に平仓し,最大限に損失拡大を回避する.
- RSIの指標を使って,超売り状況を判断し,短期間の超落後後,タイムリーで入場し,反発の機会を掴むことができます.
- コードは簡潔で効率的で,実行速度が速い,取引信号を逃さない.
戦略リスク
- RSIは落後指数であり,指数が超売りされている可能性があり,価格が引き続き下落している場合,入場者はさらなる損失のリスクに直面する可能性があります.
- 固定ストップ比率は市場の変動に動的に対応できない場合があり,市場が激しく波動する時には,固定ストップは,頻繁にストップして,その後の反転の機会を逃す可能性があります.
- 戦略には収益目標がなく,リスク管理には完全にストップ・ロスを頼るので,全体的な収益レベルが低い可能性があります.
戦略最適化の方向性
- RSI指数以外にも,MACD,KDJなどの他の技術指標を導入して,信号の正確性を向上させる.
- 停止比率を最適化して,歴史データに基づいて異なる停止比率をテストして,最適な停止比率設定を見つけることができます.
- ストップの基礎に,移動ストップまたはトラッキングストップなどのダイナミックストップメカニズムを追加することで,ストップをより柔軟に効率的にすることができます.
- 利潤目標を設定し,一定の利潤レベルに達した後に積極的に平仓し,完全に止損出場に頼るのではなく.
要約する
RSIストップトラッキング取引戦略は,RSI指標によって超売り状況を判断し,同時に固定ストップ割合を設定し,リスクを厳格に制御し,全体的な考え方は簡単で分かりやすい.初心者の学習に使用に適しています.しかし,この戦略には,遅滞性,ストップメカニズムがシンプル,利益レベルが高くない問題があり,実用的な応用で継続的に最適化改善,戦略の安定性および収益性を向上させる必要があります.
Source
Pine
Related strategies
Comment
All comments (0)
No data
- 1