移動平均プルバック追跡戦略
作成日:
2024-03-28 18:00:05
最終変更日:
2024-03-28 18:00:05
コピー:
0
クリック数:
744
1
フォロー
1750
フォロワー
概要
この戦略の主な構想は,2つの異なる周期の移動平均を利用して,市場の逆転後に反発の機会を捕捉することである.価格が長期平均線上から短期平均線への逆転が発生するときに,戦略は多額のポジションを開き,価格が短期平均線に再立ち向かうか,または停止価格に触れたときに平仓する.この戦略は,トレンドの中で逆転買い機会を探し,トレンドの動きの中で利益を得ることを目指す.
戦略原則
- 2つの異なる周期の移動平均 ((MA1とMA2) を計算し,MA1は長期平均線,MA2は短期平均線である.
- 閉盘価格がMA1以上でMA2以下であると同時に,当時はポジションを保有していないが,当時は設定された取引時間範囲で,戦略的にポジションを開く.
- ポジション開設価格のbuyPriceを記録し,ストップ価格のstopPriceを計算する.
- 策略平仓は,閉店価格がMA2に再突入し,i_lowerCloseがfalseになったとき,または閉店価格がストップ・ロスト・プライスを下回ったときである.
- i_lowerClose が true ならば,閉盘価格がMA2より高く,前K線の閉盘価格がMA2より低いときの平仓である.
戦略的優位性
- トレンド追跡:価格と長期平均線の位置関係を判断し,現在の全体的なトレンドを特定し,トレンドの中で入場機会を探します.
- 買い戻し買い:上昇傾向の中で価格を短期平均線に引き戻す買い取りの機会を探し,買い戻しポイントの価格比率を高めること.
- ストップ・ロズ・保護:ストップ・ロズ・価格を設定し,価格逆転波動が一定幅に達すると自動的に平仓し,下行リスクを効果的に制御する.
- 柔軟なパラメータ:ユーザは,自分の好みに応じて,平均線周期,ストップダストパーセント,前K線の閉盘価格が短期平均線より低いときの平仓かどうかなどのパラメータを柔軟に設定できます.
戦略リスク
- パラメータ最適化:異なるパラメータ設定は,戦略のパフォーマンスに大きく影響し,最適なパラメータ組み合わせを見つけるために,異なる市場環境でパラメータ最適化と反テストを行う必要があります.
- 振動市場:振動市場では,価格が長期間の平均線の間によく波動し,戦略が頻繁に平仓を打つことになり,取引コストがより多く損なわれる可能性があります.
- トレンド転換:市場トレンドが転換したとき,戦略が連続して損失を伴う場合がある.このとき,他の指標またはシグナルと組み合わせてトレンド転換を判断し,適切なタイミングで戦略を調整する必要があります.
- ブラック・天秤事件: 市場において,予測できない大きな突発的な出来事が起こると,価格が激しく波動し,ストップ・ストラトジーを引き起こすと,大きな損失に直面する可能性があります.
戦略最適化の方向性
- トレンド判断:ポジション開設前に,現在のトレンドの強さと方向を確認するために,ポジション開設シグナルの正確性を高めるために,ADXなどのより多くのトレンド判断指標を導入する.
- ダイナミックストップ:価格変動率,ATRなどの指標に応じてストップを動的に調整し,価格変動が大きいときにストップを適切に緩和し,価格変動が小さいときにストップを厳格にする.
- ポジション管理:市場トレンドの強さ,価格の変動率などの要因に応じて,ポジションの大きさを動的に調整し,トレンドが強く,変動率が適度なときにポジションを拡大し,トレンドが弱く,または変動率が過度に高いときにポジションを小さくする.
- 多空間のヘッジ:多空間の両者の信号を同時に監視することを考え,異なる市場または周期でポジションを開設してヘッジし,戦略の全体的なリスクを軽減する.
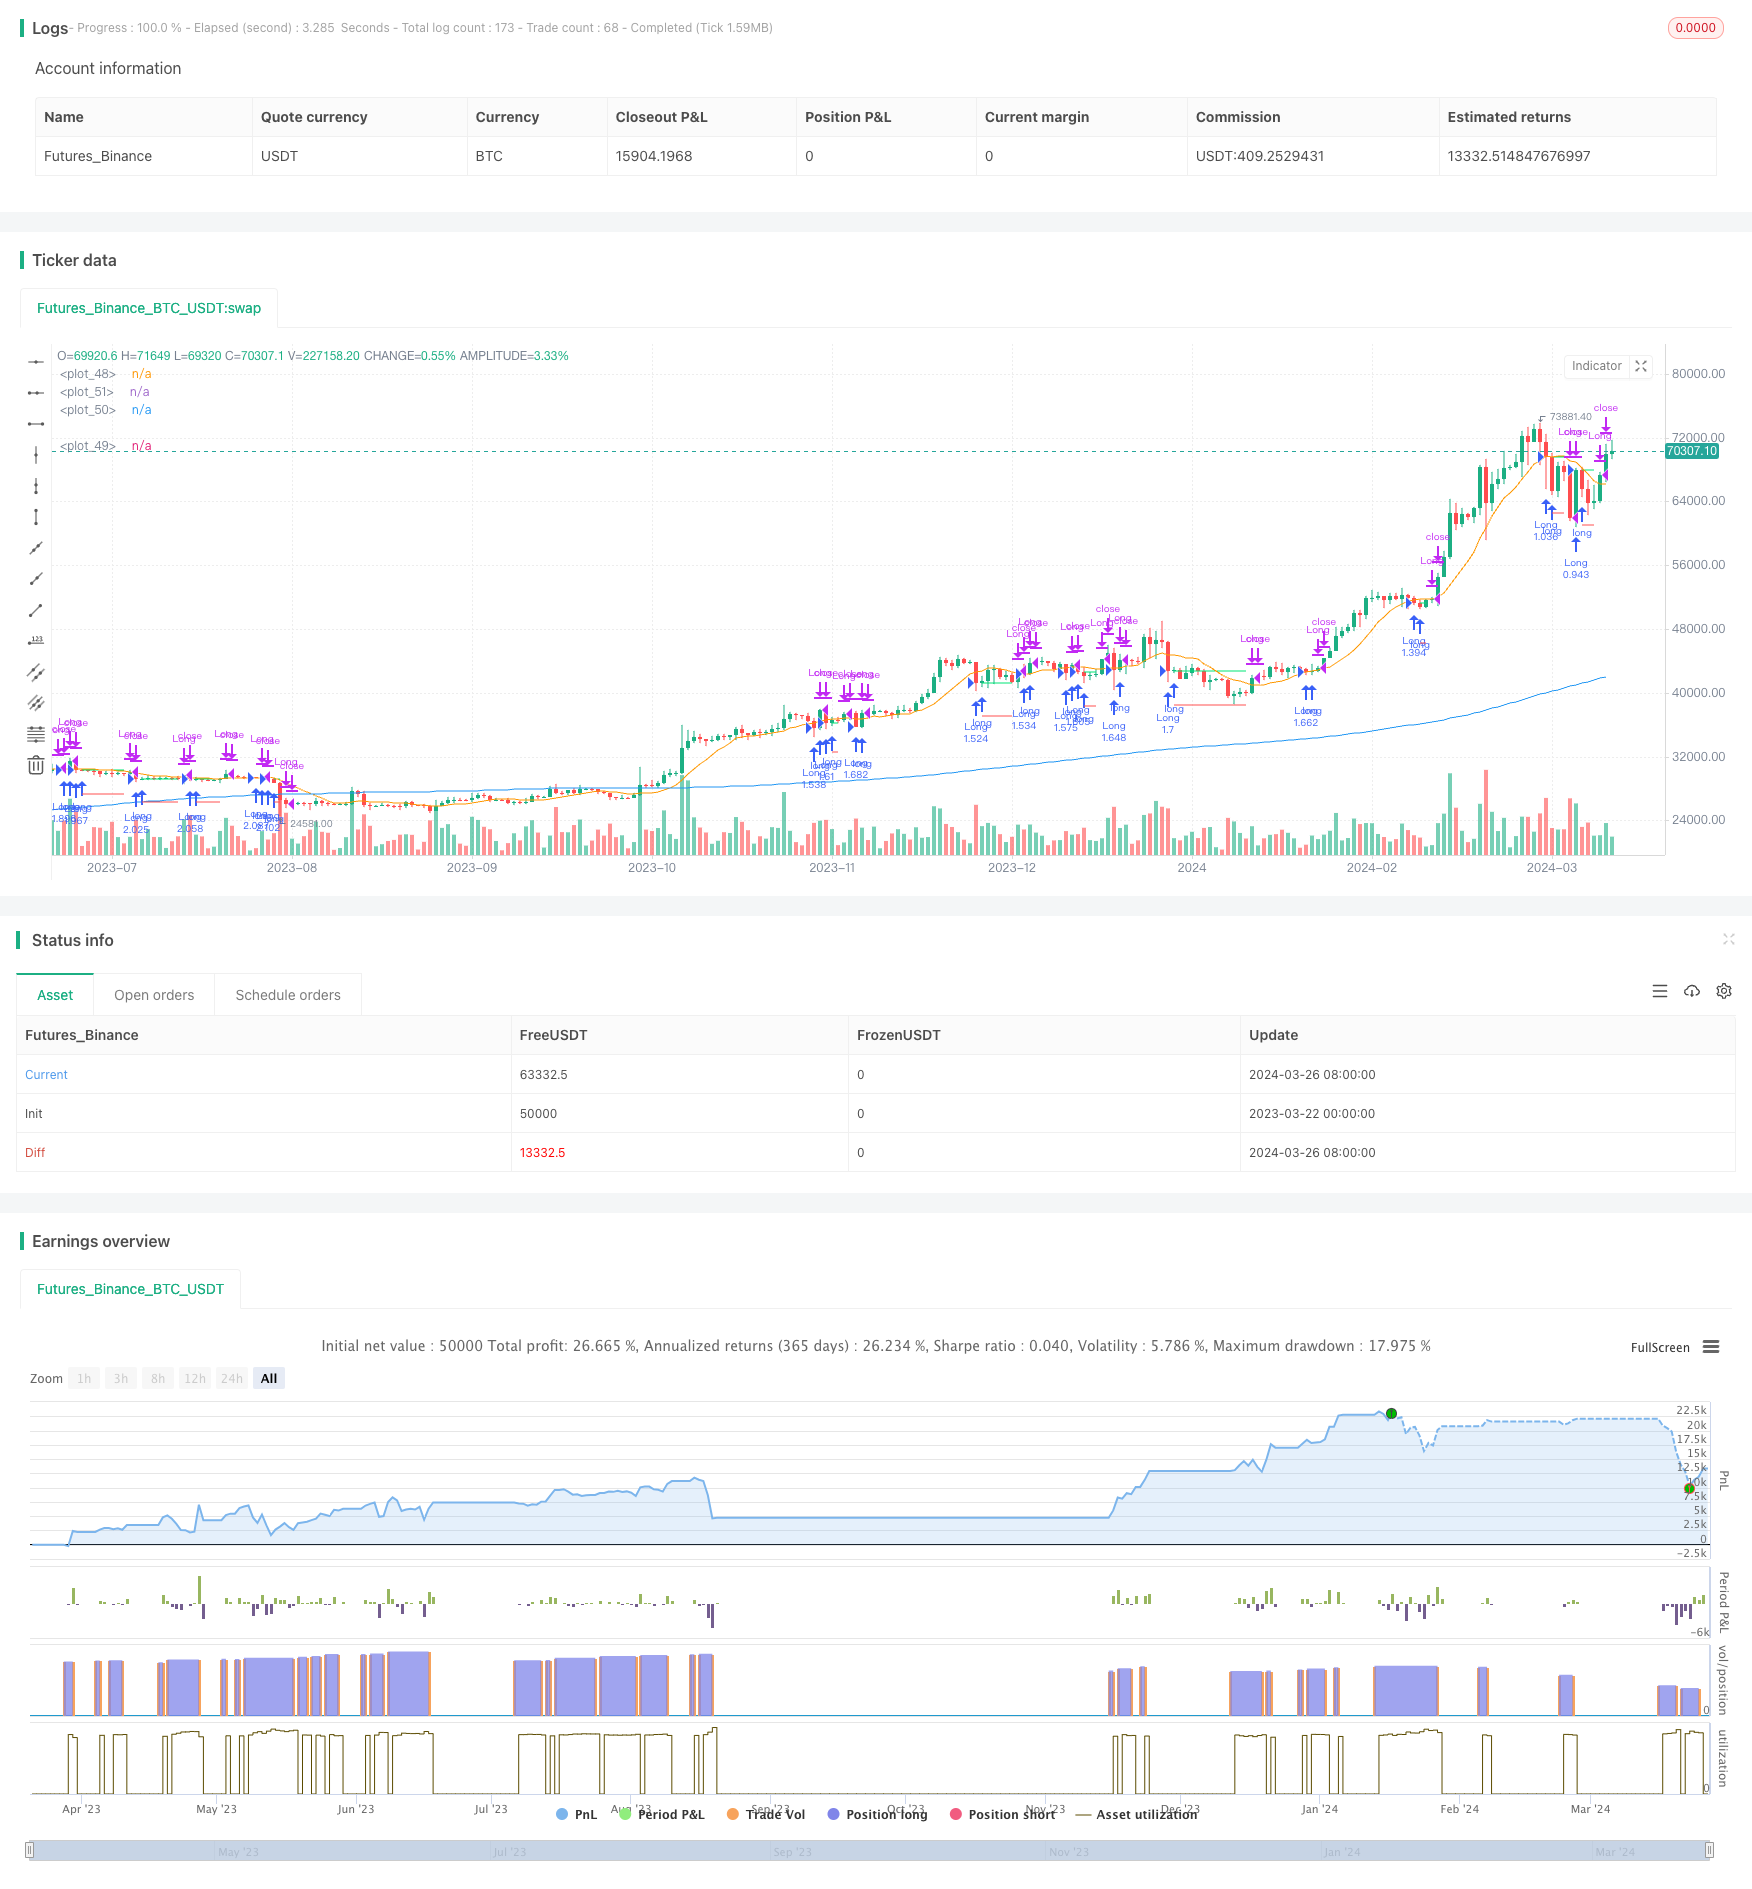
要約する
移動平均の逆転を追跡する戦略は,2つの異なる周期平均線の相対的な位置関係によって,価格が上昇傾向で逆転する複数の機会を捕捉する.この戦略は,トレンド型市場に適用され,適切なパラメータとストップを設定することにより,トレンドの状況で安定した利益を得ることができます.しかし,揺れ動いた市場とトレンドの転換時には,この戦略は一定のリスクに直面します.より多くの指標,ポジション管理の最適化,動的上昇の止まる方法などの導入により,この戦略のパフォーマンスと安定性をさらに向上させることができます.
ストラテジーソースコード
/*backtest
start: 2023-03-22 00:00:00
end: 2024-03-27 00:00:00
period: 1d
basePeriod: 1h
exchanges: [{"eid":"Futures_Binance","currency":"BTC_USDT"}]
*/

// This Pine Script™ code is subject to the terms of the Mozilla Public License 2.0 at https://mozilla.org/MPL/2.0/
// © contapessoal_ivan
// @version=5
strategy("Pullback Strategy",
     overlay=true,
     initial_capital=1000,
     default_qty_type=strategy.percent_of_equity,
     default_qty_value=100, // 100% of balance invested on each trade
     commission_type=strategy.commission.cash_per_contract,
     commission_value=0.005) // Interactive Brokers rate

// Get user input
i_ma1           = input.int(title="MA 1 Length", defval=200, step=10, group="Strategy Parameters", tooltip="Long-term MA")
i_ma2           = input.int(title="MA 2 Length", defval=10, step=10, group="Strategy Parameters", tooltip="Short-term MA")
i_stopPercent   = input.float(title="Stop Loss Percent", defval=0.10, step=0.1, group="Strategy Parameters", tooltip="Failsafe Stop Loss Percent Decline")
i_lowerClose    = input.bool(title="Exit On Lower Close", defval=false, group="Strategy Parameters", tooltip="Wait for a lower-close before exiting above MA2")
i_startTime     = input(title="Start Filter", defval=timestamp("26 Jan 2023 00:00 +0000"), group="Time Filter", tooltip="Start date & time to begin searching for setups")
i_endTime       = input(title="End Filter", defval=timestamp("26 Mar 2024 23:59 +0000"), group="Time Filter", tooltip="End date & time to stop searching for setups")

// Get indicator values
ma1 = ta.sma(close, i_ma1)
ma2 = ta.sma(close, i_ma2)

// Check filter(s)
f_dateFilter = true

// Check buy/sell conditions
var float buyPrice = 0
buyCondition    = close > ma1 and close < ma2 and strategy.position_size == 0 and f_dateFilter
sellCondition   = close > ma2 and strategy.position_size > 0 and (not i_lowerClose or close < low[1])
stopDistance    = strategy.position_size > 0 ? ((buyPrice - close) / close) : na
stopPrice       = strategy.position_size > 0 ? buyPrice - (buyPrice * i_stopPercent) : na
stopCondition   = strategy.position_size > 0 and stopDistance > i_stopPercent

// Enter positions
if buyCondition
    strategy.entry(id="Long", direction=strategy.long)

if buyCondition[1]
    buyPrice := open

// Exit positions
if sellCondition or stopCondition
    strategy.close(id="Long", comment="Exit" + (stopCondition ? "SL=true" : ""))
    buyPrice := na

// Draw pretty colors
plot(buyPrice, color=color.lime, style=plot.style_linebr)
plot(stopPrice, color=color.red, style=plot.style_linebr, offset=-1)
plot(ma1, color=color.blue)
plot(ma2, color=color.orange)