ベクトルローソク足チャートに基づくチャネルブレイクアウトとカスタム ChoCH 戦略

1
Follow
1782
Followers
概要
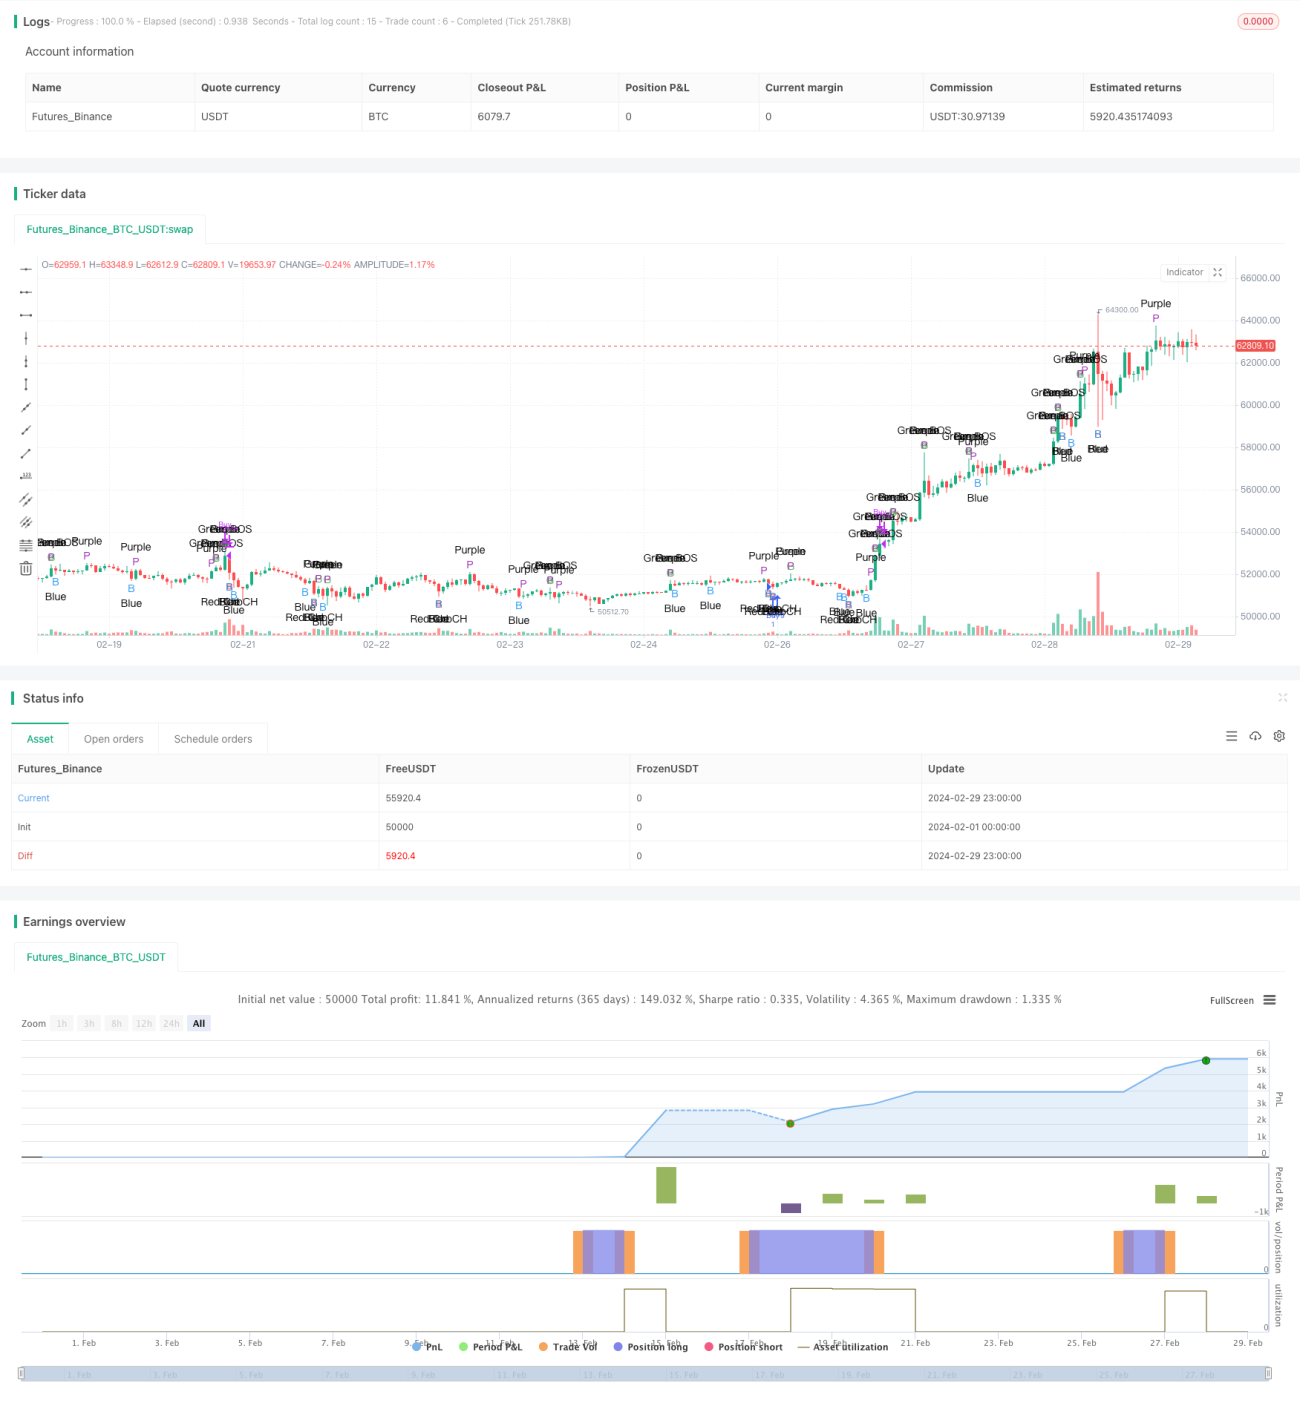
この戦略は,ベクトルチャート (Vector Candles) の概念を,伝統的なチャネルブレークアウト (Channel Breakout) とチョコレートソース (Chocolate Sauce, ChoCH) のパターンの認識と組み合わせて,市場の突破行動を捉えることを目的としています.この戦略は,前K線の高低点と,交差量の拡大されたベクトルチャートと組み合わせた,前K線の高低点との比較を収集することによって,信号を確認し,同時に,一定数の確認K線をノイズをフィルターするために使用します.
戦略原則
- 過去の一定数のK線の平均交差量を計算し,交差量の拡大倍数に応じて4種類の異なる色 (赤,緑,青,紫) のベクトルグラフを定義する.
- 閉盘価格が前K線低点より低く,赤のベクトルフィルタで表示された場合,赤色のChoCH信号として識別する.閉盘価格が前K線高点より高く,緑のベクトルフィルタで表示された場合,緑のBOS信号として識別する.
- 定数確認K線内において,赤いベクトル<unk>図が設定<unk>値に達する回数が発生した場合,赤いChoCH信号が確認される.緑のベクトル<unk>図が設定<unk>値に達する回数が発生した場合,緑のBOS信号が確認される.
- 赤いChoCH信号が確認されたときに多仓を打つ.緑のBOS信号が確認されたときに平仓する.
戦略的優位性
- 矢量<unk>図と従来のチャネルブレイクとChoCHモードを組み合わせることで,信号の信頼性が向上した.
- 確認K線メカニズムが導入され,ノイズと偽信号を効果的にフィルターする.
- 矢量フィルタの色の区分により,信号はより直感的で識別が容易になります.
- パラメータは調整可能で,柔軟性があり,異なる市場環境と取引スタイルに応じて最適化できます.
戦略リスク
- 波動的な市場では,頻繁に突破や引き下がりが起こり,その策略が偽信号や損なわれた取引を多く生み出す可能性があります.
- 確認K線の数値設定が不適切である場合,信号の遅延または早期入場を引き起こす可能性があります.
- 基本的な要素を無視して,技術指標にだけ頼り,意外なリスクに直面するかもしれない.
- 戦略はストップを設定していないため,急激に市場が逆転すると大きな損失を負う可能性があります.
戦略最適化の方向性
- 移動平均のようなトレンド確認指標を導入し,突破信号が発生した後にトレンドの方向を確認し,信号の質を向上させる.
- 振動市場では,通路内の多行と空間のトリガー条件の設定など,範囲取引戦略を導入することを考えることができます.
- 確認K線の数を最適化し,適切なバランスポイントを見つけ,ノイズを効率的にフィルターし,遅滞を避けます.
- 合理的なストップ・ロズとストップ・ストップのルールを設定し,単一取引のリスクと全体的な撤回を制御する.
- 他の技術指標や市場情緒指標と組み合わせると,取引の意思決定に役立つ.
要約する
この戦略は,ベクトルフィルタをクラシックなチャネルブレイクとChoCHモデルと組み合わせて,カラー区分とK線メカニズムを確認することで,信号の信頼性と認識度を向上させる.戦略の優点は,規則の明確性,信号の直感性であり,一定の柔軟性と最適化可能なスペースがあることである.しかしながら,戦略には,市場のトレンドの把握が不足し,ストップダスト管理の欠如など,いくつかの制限とリスクがある.将来,トレンドの確認,範囲取引,パラメータの最適化,リスク管理などから戦略を完善して,より安定した取引パフォーマンスを得ることができる.
Source
Pine
Strategy parameters
Related strategies
Comment
All comments (0)
No data
- 1