修正相対力指数トレンドフォロー戦略
作成日:
2024-03-29 16:16:37
最終変更日:
2024-03-29 16:16:37
コピー:
10
クリック数:
728
1
フォロー
1750
フォロワー
概要
この戦略は,修正された比較的強い指数 (Modified RSI) をベースに市場トレンドを捉えます.戦略の主なアイデアは,Modified RSI指標のクロスシグナルと直方図シグナルを使用して市場トレンドを判断し,トレンドの方向に従って取引することです.
戦略原則
- 価格のEMAをModified RSIの入力として計算する
- 修正RSIを計算する
- Modified RSIのEMAをシグナルラインとして計算する
- 修正RSIと信号線の差を直角図として計算する
- Modified RSIで信号線を横切って直角図が0より大きいとき,買取信号が生成される
- Modified RSIの下を通過し,直角図が0より小さいとき,売り信号が生成される
戦略的優位性
- Modified RSIは,従来のRSIよりもトレンドをよく捉える
- Modified RSIのクロス信号と直角図信号を組み合わせて,偽信号を効果的にフィルターする.
- パラメータは,異なる市場と周期に対応して調整可能
- 簡潔で計算効率が高い
戦略リスク
- Modified RSIは,変動する市場において誤信号を誘発する.
- トレンド転換点の捉え方は遅れている
- 単一の指標は価格の騒音に 影響されやすい
戦略最適化の方向性
- 移動平均などの他のトレンド指標と組み合わせることで,信号の信頼性を高めることができます.
- ストップ・ストップ・モジュールが追加され,単一取引のリスクを制御できます.
- 異なる市場特性を考慮して最適化できるパラメータ
- ポジション管理モジュールを追加して,ポジションを動的に調整できます.
要約する
この戦略は,修正RSI指標の特性を利用し,トレンド追跡の観点から取引システムを構築する.修正RSI指標は,従来のRSI指標の欠陥を克服し,トレンドキャプチャの能力は比較的強い.しかし,単一の指標の戦略は,多くの場合,限界があり,他の技術的手段と組み合わせて改善する必要があります.戦略のパラメータを最適化,信号源を豊かにし,風力制御モジュールを追加するなどの方法により,戦略の安定性と収益性をさらに向上させることができます.
ストラテジーソースコード
/*backtest
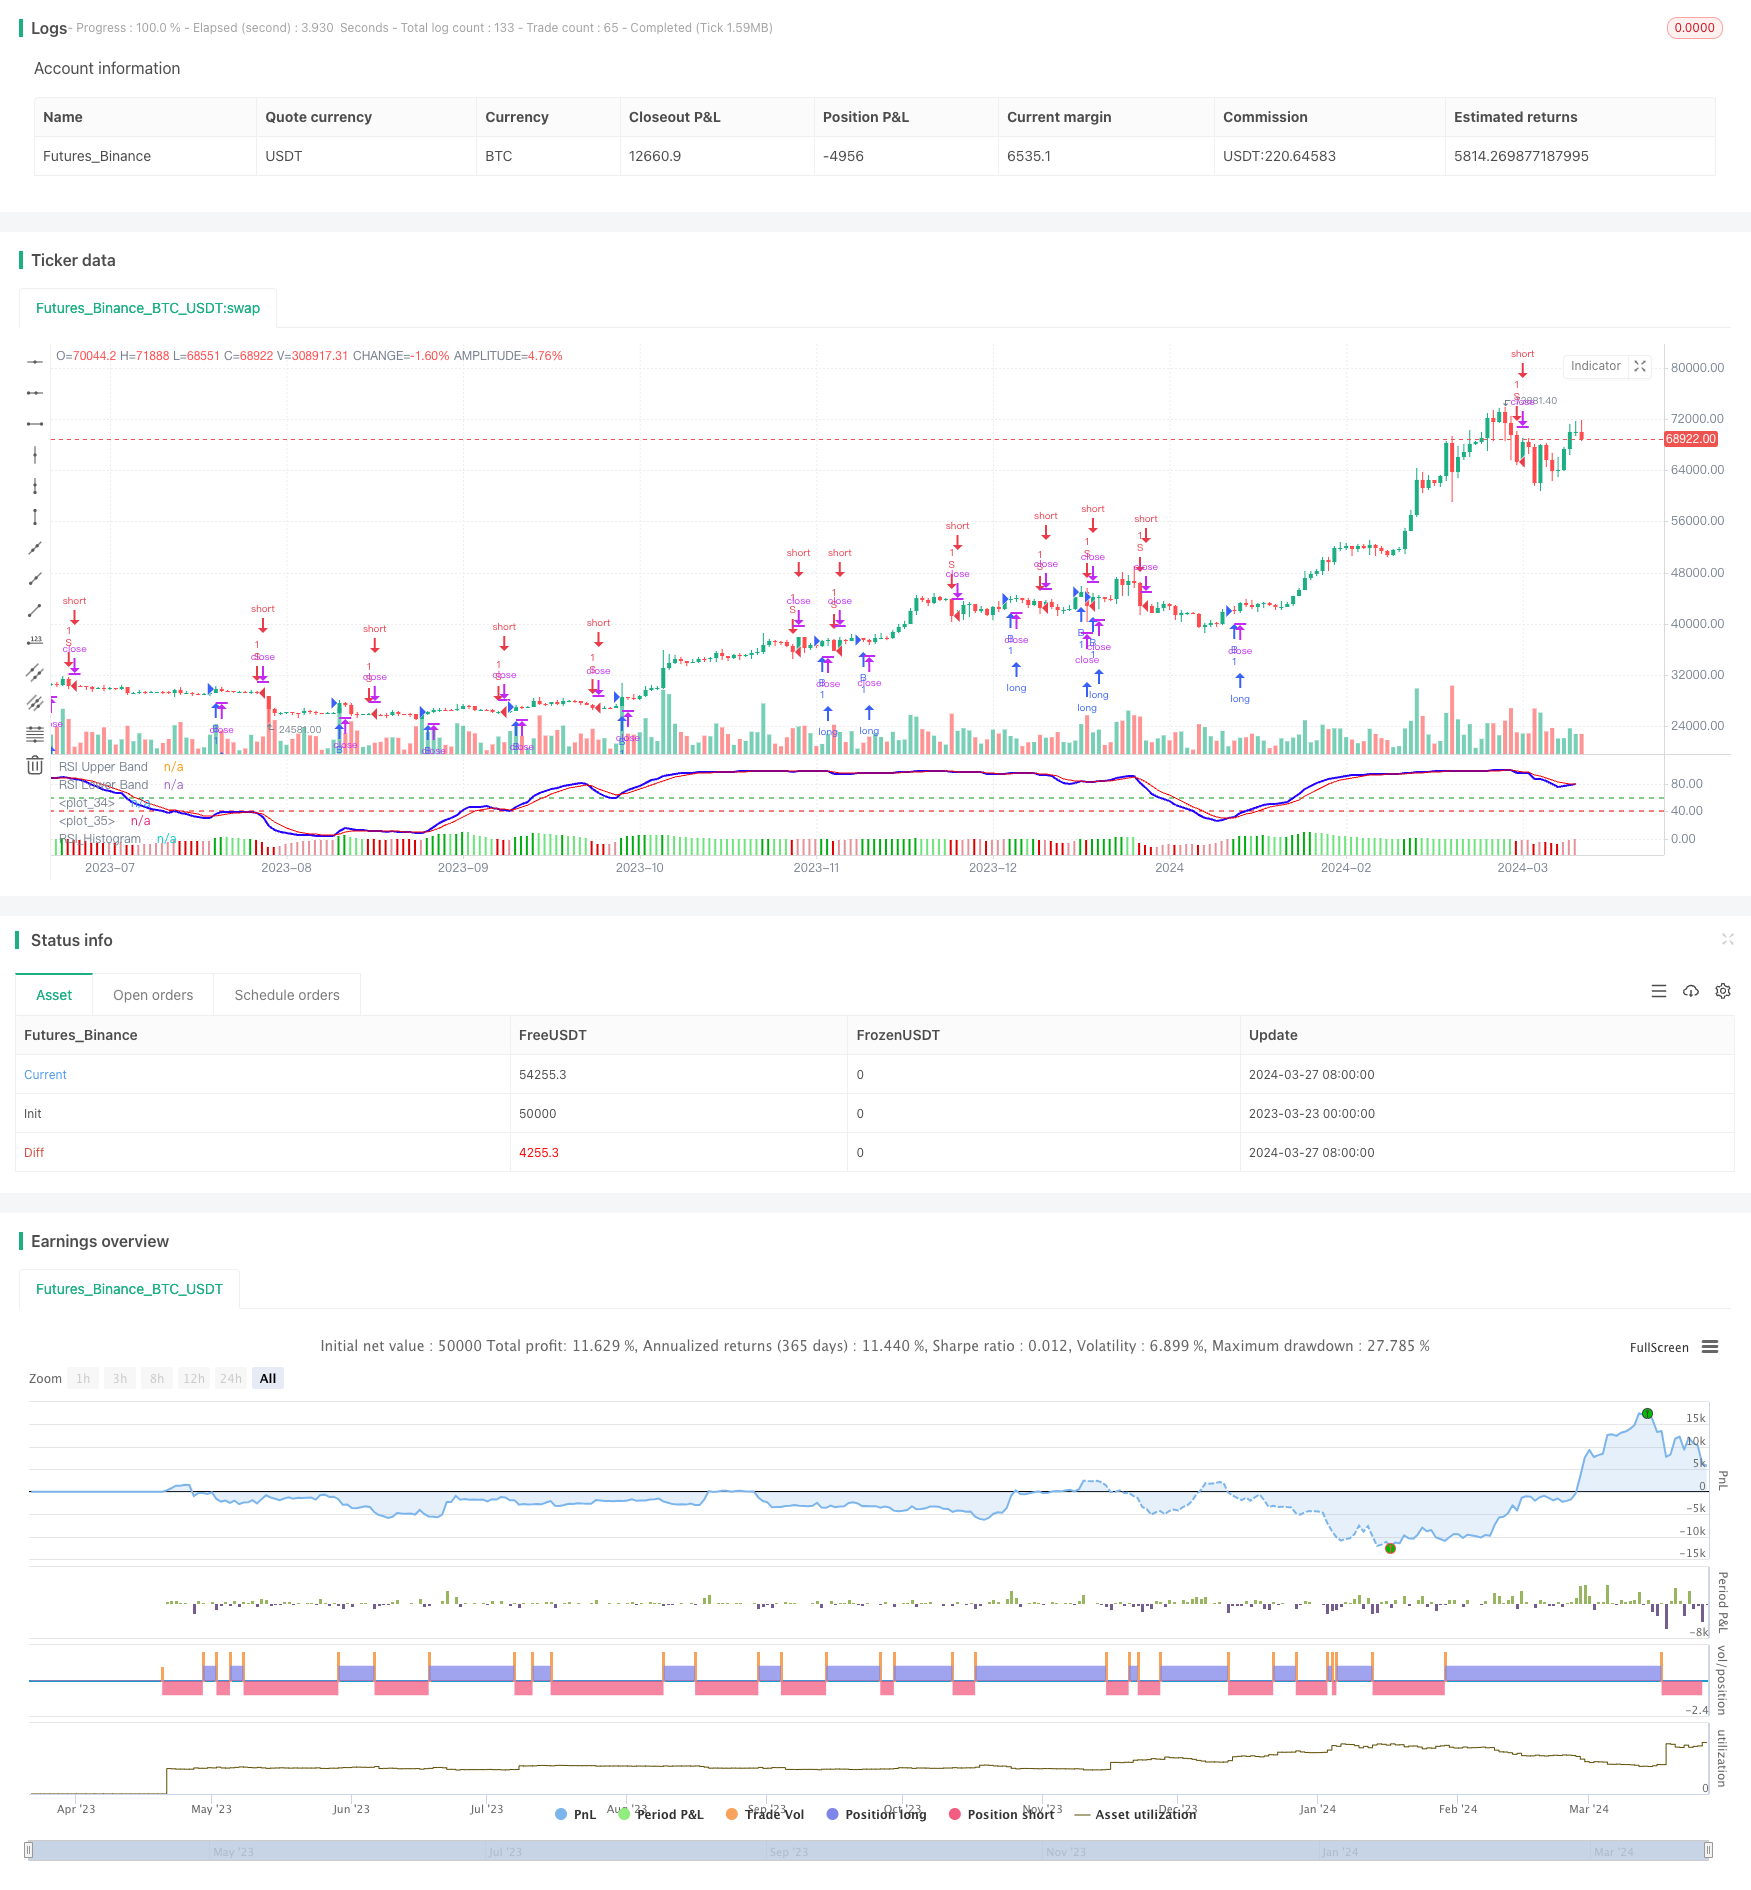
start: 2023-03-23 00:00:00
end: 2024-03-28 00:00:00
period: 1d
basePeriod: 1h
exchanges: [{"eid":"Futures_Binance","currency":"BTC_USDT"}]
*/
// This source code is subject to the terms of the Mozilla Public License 2.0 at https://mozilla.org/MPL/2.0/
// © YogirajDange
//@version=5
// Verical lines
// // Define the times
// t1 = timestamp(year, month, dayofmonth, 09, 15) // 9:15
// t2 = timestamp(year, month, dayofmonth, 11, 15) // 11:15
// t3 = timestamp(year, month, dayofmonth, 13, 15) // 1:15
// t4 = timestamp(year, month, dayofmonth, 15, 25) // 3:25
// // Check if the current bar is on the current day
// is_today = (year(time) == year(timenow)) and (month(time) == month(timenow)) and (dayofmonth(time) == dayofmonth(timenow))
// // Draw a vertical line at each time
// if is_today and (time == t1 or time == t2 or time == t3 or time == t4)
// line.new(x1 = bar_index, y1 = low, x2 = bar_index, y2 = high, extend = extend.both, color=color.red, width = 1)
strategy('Modified RSI')
col_grow_above = input(#02ac11, "Above Grow", group="Histogram", inline="Above")
col_fall_above = input(#6ee47d, "Fall", group="Histogram", inline="Above")
col_grow_below = input(#e5939b, "Below Grow", group="Histogram", inline="Below")
col_fall_below = input(#dd0000, "Fall", group="Histogram", inline="Below")
EMA_length = input.int(13, 'Price_EMA', minval=1)
RSI_length = input.int(14, 'RSI_Period', minval=1)
Avg_length = input.int(5, 'RSI_Avg_EMA', minval=1)
fastMA = ta.ema(close, EMA_length)
modrsi = ta.rsi(fastMA, RSI_length)
RSIAVG = ta.ema(modrsi, Avg_length)
plot(modrsi, color=color.rgb(38, 0, 255), linewidth=2)
plot(RSIAVG, color=color.rgb(247, 0, 0))
rsiUpperBand = hline(60, 'RSI Upper Band', color=#099b0e)
//hline(50, "RSI Middle Band", color=color.new(#787B86, 50))
rsiLowerBand = hline(40, 'RSI Lower Band', color=#e90101)
RSI_hist = modrsi - RSIAVG
//plot(RSI_hist,"RSI_Histogram", color = #c201e9, style = plot.style_columns,linewidth= 5)
plot(RSI_hist, title="RSI_Histogram", style=plot.style_columns, color=(RSI_hist>=0 ? (RSI_hist[1] < RSI_hist ? col_grow_above : col_fall_above) : (RSI_hist[1] < RSI_hist ? col_grow_below : col_fall_below)))
/////// Moving Averages 20 50 EMA
fast_ma = input.int(20, minval=2, title="Fast_EMA")
slow_ma = input.int(50, minval=2, title="Slow_EMA")
src = input.source(close, title="Source")
out = ta.ema(src, fast_ma)
out1 = ta.ema(src, slow_ma)
//plot(out, title="20 EMA", color=color.rgb(117, 71, 247), linewidth = 2)
//plot(out1, title="50 EMA", color=color.rgb(0, 0, 0), linewidth = 2)
longCondition = ((ta.crossover(modrsi, RSIAVG)) and (RSI_hist > 0))
if longCondition
strategy.entry('B', strategy.long)
shortCondition = ((ta.crossunder(modrsi, RSIAVG)) and (RSI_hist < 0))
if shortCondition
strategy.entry('S', strategy.short)