二重移動平均ラグブレイクスルー戦略
概要
“双均線遅延突破策”は,よく使われる技術分析取引策である.この策は,2つの異なる周期の簡易移動平均 ((SMA) と平均真波幅 ((ATR) の指標を組み合わせ,市場傾向の転換点を捕捉し,低リスクの高収益の取引を実現することを目的としている.その核心思想は,均線の遅延性と市場の変動性を利用し,価格が均線を破り,波動率が制御可能な範囲にあるときに取引信号を生成することである.
戦略原則
この戦略の基本原則は以下の通りです.
- 異なる周期の2つの単純な移動平均 ((SMA) を計算し,デフォルト周期は14と50である.
- ATR指標を計算し,市場の変動率を測定するために,デフォルト周期は14である.
- 価格変動の参照区間としてATRの上下線を描画する.上線は最高価格加算ATRの倍数 (デフォルト1.5) から得られ,下線は最低価格減算ATRの倍数から得られる.
- 閉店価格が短期平均線を横切り,短期平均線が長期平均線上にあるとき,多行シグナルが生み出され,K線の下に上向きの矢印が描かれます.
- 閉店価格が短期平均線を下に横切られ,短期平均線が長期平均線を下に横切ると,空白信号が生成され,K線上方へ下向きの矢印が描かれます.
- ストップとストップを設定し,ストップは最低価格減算ATR倍数,ストップは開設価格加算 (開設価格 - ストップ) の倍数とする.
上記の原理から,この戦略は,均線システムのトレンド判断とATR指標の波動率測定を組み合わせ,トレンド追跡を主として,引き返しのリスクを制御しながら,トレンド型戦略であることがわかります.
優位分析
“双均線落後突破戦略”には以下の利点があります.
- トレンド追跡:均線システムによってトレンド方向を判断し,大きな市場トレンドを捕捉し,市場に従います.
- リスクコントロール:ATR指標を使用して市場の変動率を測定し,合理的なストップ・ローズを設定し,引き下げを許容範囲で制御する.
- パラメータの柔軟性:平均線周期,ATR周期,倍数などのパラメータは,異なる市場と品種に応じて最適化および調整することができ,一定の普遍性がある.
- 取引のシグナルがシンプルでわかりやすく,様々なレベルの投資家に適しています.
リスク分析
この戦略には利点があるものの,以下のリスクがあります.
- 頻繁に取引する:市場が波動的で,トレンドは不明であるときに,この戦略は頻繁に取引シグナルを生じ,取引コストを増加させる可能性があります.
- 落後性:均線システムは本質的に一定の落後性があり,市場転換の初期に一定の後退が生じることがあります.
- パラメータ最適化:異なるパラメータ設定は,戦略のパフォーマンスに大きな影響を及ぼし,異なる市場と品種に対してパラメータ最適化を行う必要があり,実施の難しさが増加する.
このリスクに対して,以下の点で最適化や改善を行うことができます.
- トレンドフィルターの導入:取引シグナルを生成する前に,大周期のトレンド方向を判断し,大周期のトレンドが明確である場合にのみ取引を行い,取引の頻度を減らす.
- ストップ・ストップの最適化:移動ストップ,波動率ストップなどのダイナミックストップの導入を考慮し,市場の波動率の動向に応じてストップ・ポジションを調整し,戦略の柔軟性を高めることができます.
- 組合せ最適化:この戦略を他の技術指標または基本的要素と組み合わせて,戦略の安定性を高める.
最適化の方向
この戦略は以下の点で最適化できます.
- 参数自適應最適化:異なる品種と周期に対して,自動的に最適の参数組み合わせを探し,人工の参数调度作業量を減らす. 遺伝的アルゴリズム,格子検索などの方法を採用して最適化することができる.
- 信号フィルタリング:取引信号を生成した後,他の技術指標または基本的要因をさらに導入して信号の二次確認を行い,信号の質を向上させることができる.例えば,取引量指標を追加して,トレンドの強さを判断する.マクロ経済データを追加して,トレンドの継続に有利かどうかを判断する.
- ポジション管理:ポジション開設時に,市場波動率,口座リスクなどの要因に基づいてポジションサイズを動的に調整し,単一取引のリスクを制御することができる.例えば,ケリー公式,固定比率法などの方法を使用してポジション管理を行う.
- 移動ストップ:初期ストップは固定され,価格が有利な方向に移動するにつれて,ストップを有利な方向に移動させることも考えることができます. 撤回を軽減し,資金利用効率を向上させます. 追跡ストップ,破位ストップなどの一般的な方法があります.
上記の最適化は,戦略の適応性,安定性,収益性を向上させることができます.しかし,過度な最適化は,戦略曲線の適合につながり,サンプル外での不良なパフォーマンスを引き起こす可能性があるので,サンプル内および外での十分なフィットバック検証が必要であることに注意してください.
要約する
“双均線遅れ突破戦略”は,均線システムによってトレンドの方向を判断し,ATR指標を利用してリスクを制御し,トレンドの動きを捉えると同時にリスク管理を兼ね備えるクラシックなトレンド追跡型の戦略である.一定の遅滞性および頻繁な取引の問題があるにもかかわらず,停止損失を最適化し,信号フィルタリング,パラメータの適応,最適化,ポジション管理などの方法を導入することにより,この戦略のパフォーマンスをさらに向上させ,実用的な量化取引戦略にすることができる.
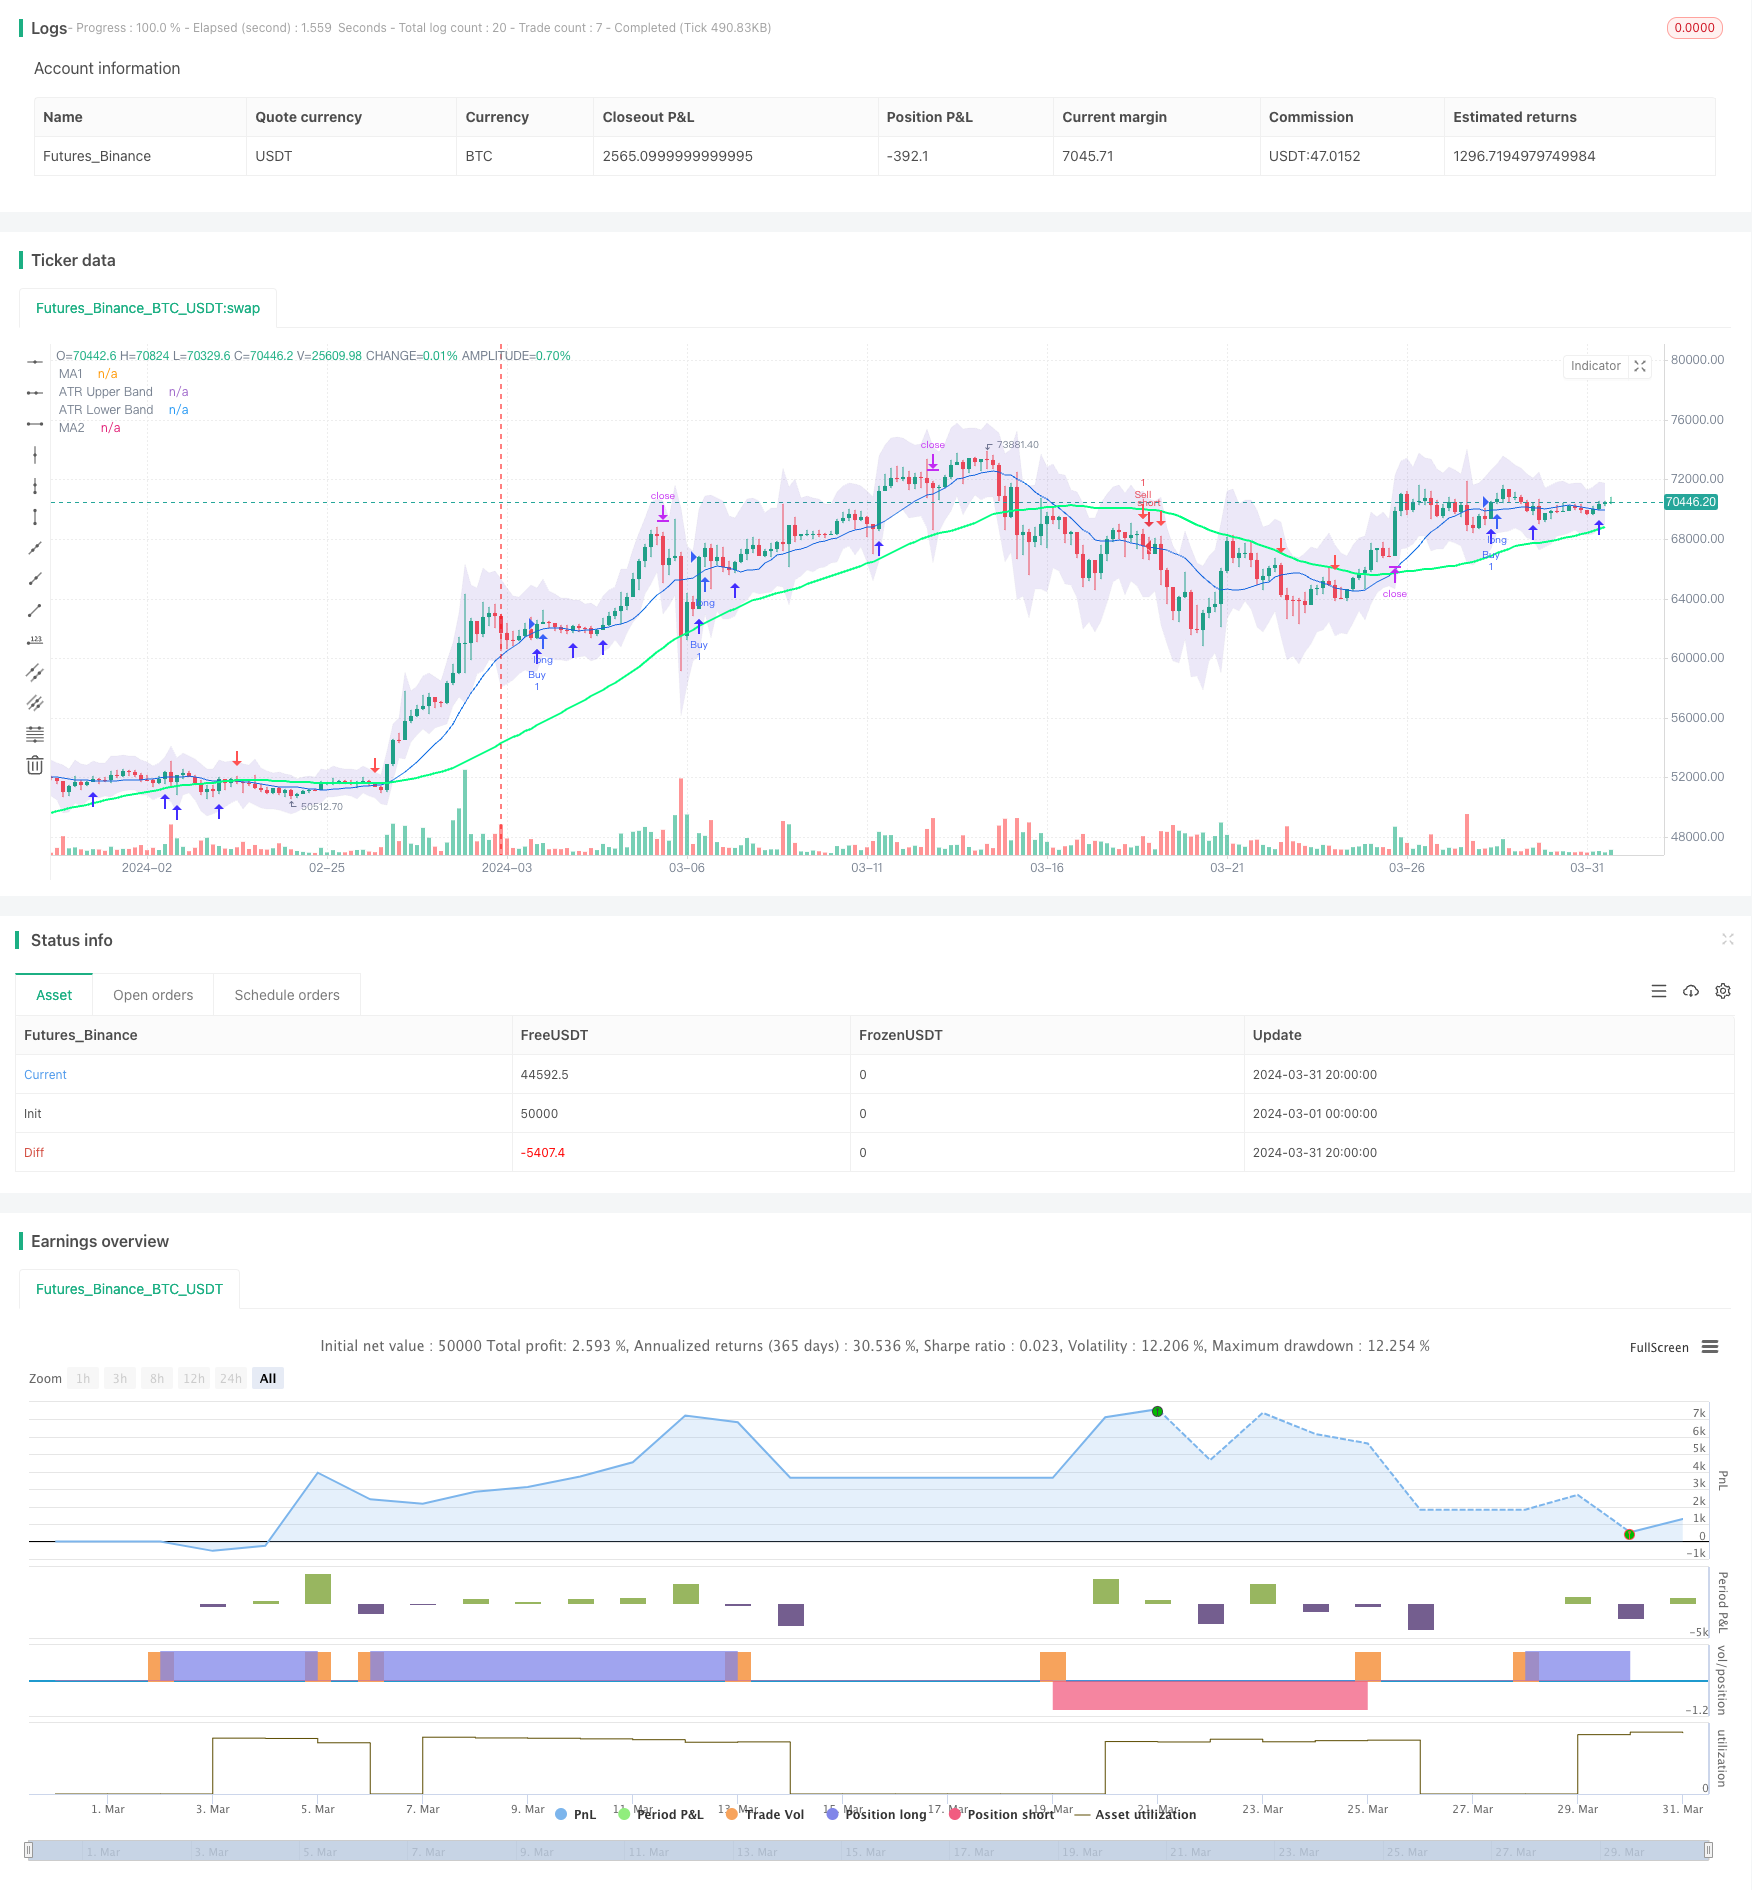
/*backtest
start: 2024-03-01 00:00:00
end: 2024-03-31 23:59:59
period: 4h
basePeriod: 15m
exchanges: [{"eid":"Futures_Binance","currency":"BTC_USDT"}]
*/

//@version=4
strategy(title="2 Moving Averages", shorttitle="2MA", overlay=true)

// Moving Averages
len = input(14, minval=1, title="Length MA1")
src = input(close, title="Source MA1")
ma1 = sma(src, len)

len2 = input(50, minval=1, title="Length MA2")
src2 = input(close, title="Source MA2")
ma2 = sma(src2, len2)

// Plotting Moving Averages
plot(ma1, color=#0b6ce5, title="MA1")
plot(ma2, color=#00ff80, linewidth=2, title="MA2")

// ATR Bands
atrLength = input(14, title="ATR Length")
atrMultiplier = input(1.5, title="ATR Multiplier")
upperBand = high + atr(atrLength) * atrMultiplier
lowerBand = low - atr(atrLength) * atrMultiplier

u =plot(upperBand, color=color.rgb(217, 220, 223, 84), title="ATR Upper Band")
l = plot(lowerBand, color=color.rgb(217, 220, 223, 84), title="ATR Lower Band")
fill(u, l, color=#471eb821, title="ATR Background")

// Conditions for plotting arrows
upArrowCondition = ma1 > ma2 and crossover(close, ma1)
downArrowCondition = ma1 < ma2 and crossunder(close, ma1)

// Plotting arrows
plotshape(upArrowCondition, style=shape.arrowup, color=color.rgb(66, 45, 255), size=size.normal, location=location.belowbar, title="Up Arrow")
plotshape(downArrowCondition, style=shape.arrowdown, color=color.red, size=size.normal, location=location.abovebar, title="Down Arrow")
// Checkbox for trade execution
showTrades = input(true, title="Hiển thị giao dịch")

// Buy Condition
if (upArrowCondition and showTrades)
    strategy.entry("Buy", strategy.long)

// Sell Condition
if (downArrowCondition and showTrades)
    strategy.entry("Sell", strategy.short)

// Stop Loss and Take Profit
stopLossBuy = low - atr(14) * atrMultiplier
takeProfitBuy = close + (close - stopLossBuy) * 2

stopLossSell = high + atr(14) * atrMultiplier
takeProfitSell = close - (stopLossSell - close) * 2

strategy.exit("Exit Buy", "Buy", stop=stopLossBuy, limit=takeProfitBuy)
strategy.exit("Exit Sell", "Sell", stop=stopLossSell, limit=takeProfitSell)