
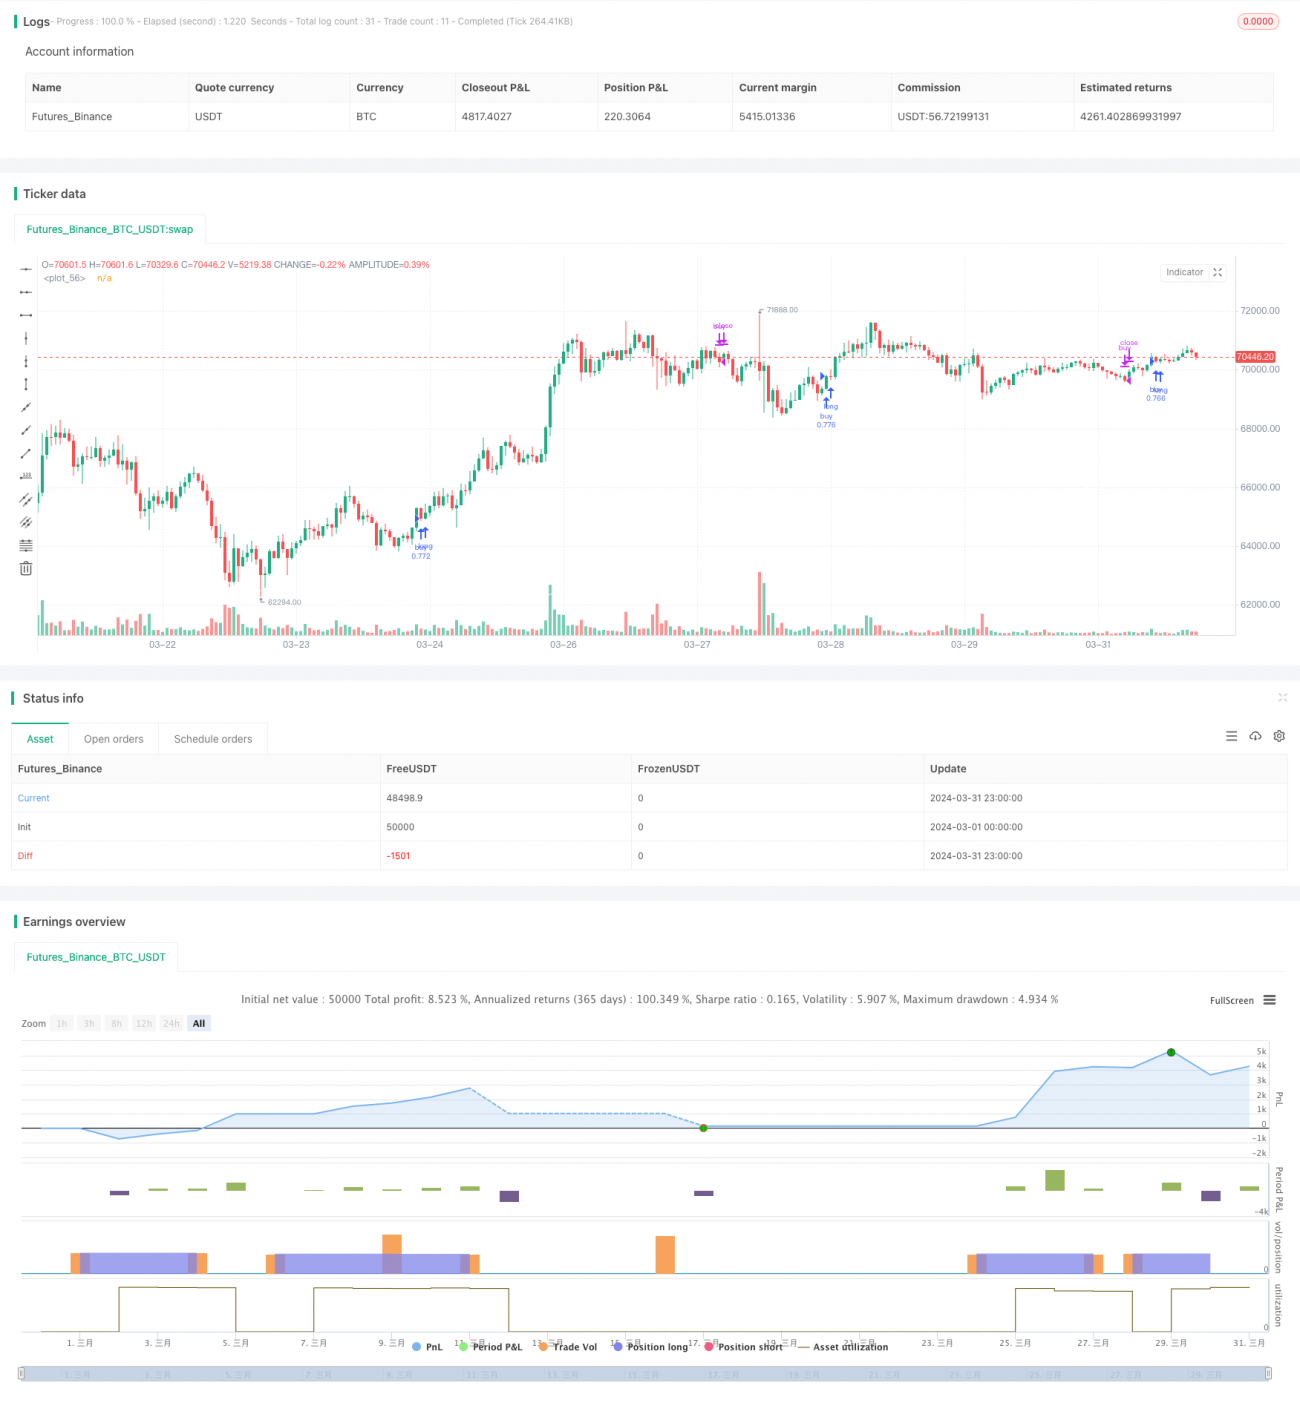
この戦略は,複数の移動平均 ((VWMA),平均方向性指数 ((ADX) および動向指標 ((DMI) を利用して,ビットコイン市場における多角的な機会を捕捉する.価格の動量,トレンドの方向,取引量などの複数の技術指標を組み合わせて,この戦略は,上昇傾向が強く,十分な動量を持つエントリースポットを見つけ,リスクを厳しく管理することを目的としている.
VWMA-ADXビットコイン多頭戦略は,価格動向,動量,取引量などの複数の技術指標を総合的に考慮することにより,ビットコイン市場における上昇の機会をより効果的に捕捉することができる.同時に,厳格なリスク管理措置と明確な平仓条件により,この戦略のリスクはより良く管理される.しかし,この戦略には,市場環境の変化への適応性の欠如,および最適化されるべき損失停止戦略などのいくつかの制限があります.将来,信号の信頼性,リスク管理,パラメータ最適化などの側面からスタートして,戦略の安定性と収益性をさらに向上させることができます.全体的に,VWMA-ADXビットコイン多頭戦略は,投資家に動量と傾向に基づく体系的な取引方法を提供し,価値を探求し,さらに改善します.
/*backtest
start: 2024-03-01 00:00:00
end: 2024-03-31 23:59:59
period: 1h
basePeriod: 15m
exchanges: [{"eid":"Futures_Binance","currency":"BTC_USDT"}]
*/
// This Pine Script™ code is subject to the terms of the Mozilla Public License 2.0 at https://mozilla.org/MPL/2.0/
// © Q_D_Nam_N_96
//@version=5
strategy("Long BTC Strategy", overlay=true,
default_qty_type = strategy.percent_of_equity,
default_qty_value = 100, initial_capital = 1000, currency = currency.USD)
Volume_Quartile(vol) =>
qvol1 = ta.percentile_linear_interpolation(vol, 60,15)
qvol2 = ta.percentile_linear_interpolation(vol, 60,95)
vol > qvol1 and vol < qvol2
smma(src, length) =>
smma = 0.0
smma := na(smma[1]) ? ta.sma(src, length) : (smma[1] * (length - 1) + src) / length
smma
ma(source, length, type) =>
switch type
"SMA" => ta.sma(source, length)
"EMA" => ta.ema(source, length)
"RMA" => ta.rma(source, length)
"WMA" => ta.wma(source, length)
"VWMA" => ta.vwma(source, length)
"HMA" => ta.hma(source, length)
"SMMA" => smma(source, length)
DMI(len, lensig) =>
up = ta.change(high)
down = -ta.change(low)
plusDM = na(up) ? na : (up > down and up > 0 ? up : 0)
minusDM = na(down) ? na : (down > up and down > 0 ? down : 0)
trur = ta.rma(ta.tr, len)
plus = fixnan(100 * ta.rma(plusDM, len) / trur)+11
minus = fixnan(100 * ta.rma(minusDM, len) / trur)-11
sum = plus + minus
adx = 100 * ta.vwma(math.abs(plus - minus-11) / (sum == 0 ? 1 : sum), lensig)
[adx, plus, minus]
cond1 = Volume_Quartile(volume*hlcc4)
ma1 = ma(close,9, "VWMA")
// plot(ma1, color = color.blue)
ma2 = ma(close,14, "VWMA")
// plot(ma2, color = color.orange)
n = switch timeframe.period
"240" => 0.997
=> 0.995
ma3 = (0.1*ma(ta.highest(close,89),89, "VWMA") +
0.9*ma(ta.lowest(close,89),89, "VWMA"))*n
plot(ma3, color = color.white)
[adx, plus, minus] = DMI(7, 10)
cond2 = adx > 18 and plus - math.abs(minus) > 15
var int count = 0
if barstate.isconfirmed and strategy.position_size != 0
count += 1
else
count := 0
p_roc = 0
if timeframe.period == '240'
p_roc := 14
else
p_roc := 10
longCondition = ta.crossover(ma1, ma2) and (close > open ? close > ma3 : open > ma3) and ((ma3 - ma3[1])*100/ma3[1] >= -0.2) and ((close-close[p_roc])*100/close[p_roc] > -2.0)
float alpha = 0.0
float sl_src = high[1]
if (longCondition and cond1 and cond2 and strategy.position_size == 0)
strategy.entry("buy", strategy.long)
if timeframe.period == '240'
alpha := 0.96
strategy.exit("exit-buy","buy", stop = sl_src*alpha)
// line.new(bar_index, sl_src*alpha, bar_index+5, sl_src*alpha, width = 2, color = color.white)
else if timeframe.period == '30'
alpha := 0.985
strategy.exit("exit-buy","buy", stop = sl_src*alpha)
// line.new(bar_index, sl_src*alpha, bar_index+20, sl_src*alpha, width = 2, color = color.white)
else if timeframe.period == '45'
alpha := 0.985
strategy.exit("exit-buy","buy", stop = sl_src*alpha)
// line.new(bar_index, sl_src*alpha, bar_index+20, sl_src*alpha, width = 2, color = color.white)
else if timeframe.period == '60'
alpha := 0.98
strategy.exit("exit-buy","buy", stop = sl_src*alpha)
// line.new(bar_index, sl_src*alpha, bar_index+20, sl_src*alpha, width = 2, color = color.white)
else if timeframe.period == '120'
alpha := 0.97
strategy.exit("exit-buy","buy", stop = sl_src*alpha)
// line.new(bar_index, sl_src*alpha, bar_index+20, sl_src*alpha, width = 2, color = color.white)
else if timeframe.period == '180'
alpha := 0.96
strategy.exit("exit-buy","buy", stop = sl_src*alpha)
// line.new(bar_index, sl_src*alpha, bar_index+20, sl_src*alpha, width = 2, color = color.white)
else if timeframe.period == 'D'
alpha := 0.95
strategy.exit("exit-buy","buy", stop = sl_src*alpha)
// line.new(bar_index, sl_src*alpha, bar_index+20, sl_src*alpha, width = 2, color = color.white)
else
alpha := 0.93
strategy.exit("exit-buy","buy", stop = sl_src*alpha)
// line.new(bar_index, sl_src*alpha, bar_index+20, sl_src*alpha, width = 2, color = color.white)
period = switch timeframe.period
"240" => 90
"180" => 59
"120" => 35
"30" => 64
"45" => 40
"60" => 66
"D" => 22
=> 64
if (count > period or close < ma3)
strategy.close('buy', immediately = true)