MACDクロスオーバー戦略

1
Follow
1780
Followers
概要
この戦略は,2つの異なる周期の指数移動平均 ((EMA) を交差して,速いEMAが下から上へゆっくりとしたEMAを横切るときに買いの信号を生じ,速いEMAが上から下へゆっくりとしたEMAを横切るときに売る信号を生じます.この戦略は,様々な金融機関と時間周期に適用できます.例えば,ゴールドは2時間周期で最も有効で,ビットコインは日線図で最も有効です.
戦略原則
- 計算速度の EMA ((デフォルト周期は12) と遅い EMA ((デフォルト周期は26)) を計算する.
- 多頭部地域 ((急速EMAは遅いEMAの上にあり,価格は急速EMAの上にあり) と空頭部地域 ((急速EMAは遅いEMAの下にあり,価格は急速EMAの下にあり) を定義する.
- 空頭領域から多頭領域に変換するときに購入し,多頭領域から空頭領域に変換するときに販売する.
- 多頭部と空頭部を緑と赤で示し,矢印で買付信号を表示する.
戦略的優位性
- シンプルで分かりやすい,初心者向け.
- 様々な金融機関や時間帯に適用可能である.
- 傾向を追跡する能力があり,中長期のトレンドを捉えることができます.
- パラメータは調整可能で,柔軟性を増す.
戦略リスク
- 市場が揺れ動いていると,誤った信号が発生し,損失を招きます.
- トレンドが逆転すると,反応が遅いので,滑り場が生じます.
- パラメータの選択が間違えば,戦略の効果に影響する.
戦略最適化の方向性
- トレンドフィルター (ADXが特定の値より大きいときにのみ取引するなど) を加え,波動市場での損失を減らす.
- ATRで,ストップダメージを決定し,単発損失を減らすなど,出場時間を最適化します.
- パラメータを最適化し,最適なパラメータの組み合わせを見つけ,安定性と収益性を向上させる.
- MACD,RSIなどの他の指標の補助判断と組み合わせると,信号の精度が向上する.
要約する
MACD交差策略は,トレンド追跡に基づく簡単な策略である.その優点は,シンプルで実用的で適用範囲が広いことであり,デメリットとしては,トレンド転換を把握することが困難であり,パラメータの選択が困難である.トレンドフィルタリング,入場場場の最適化,パラメータの選択,および他の指標の組み合わせにより,この戦略のパフォーマンスを改善することができる.この戦略は,さらなる研究とテストに値する.
Source
Pine
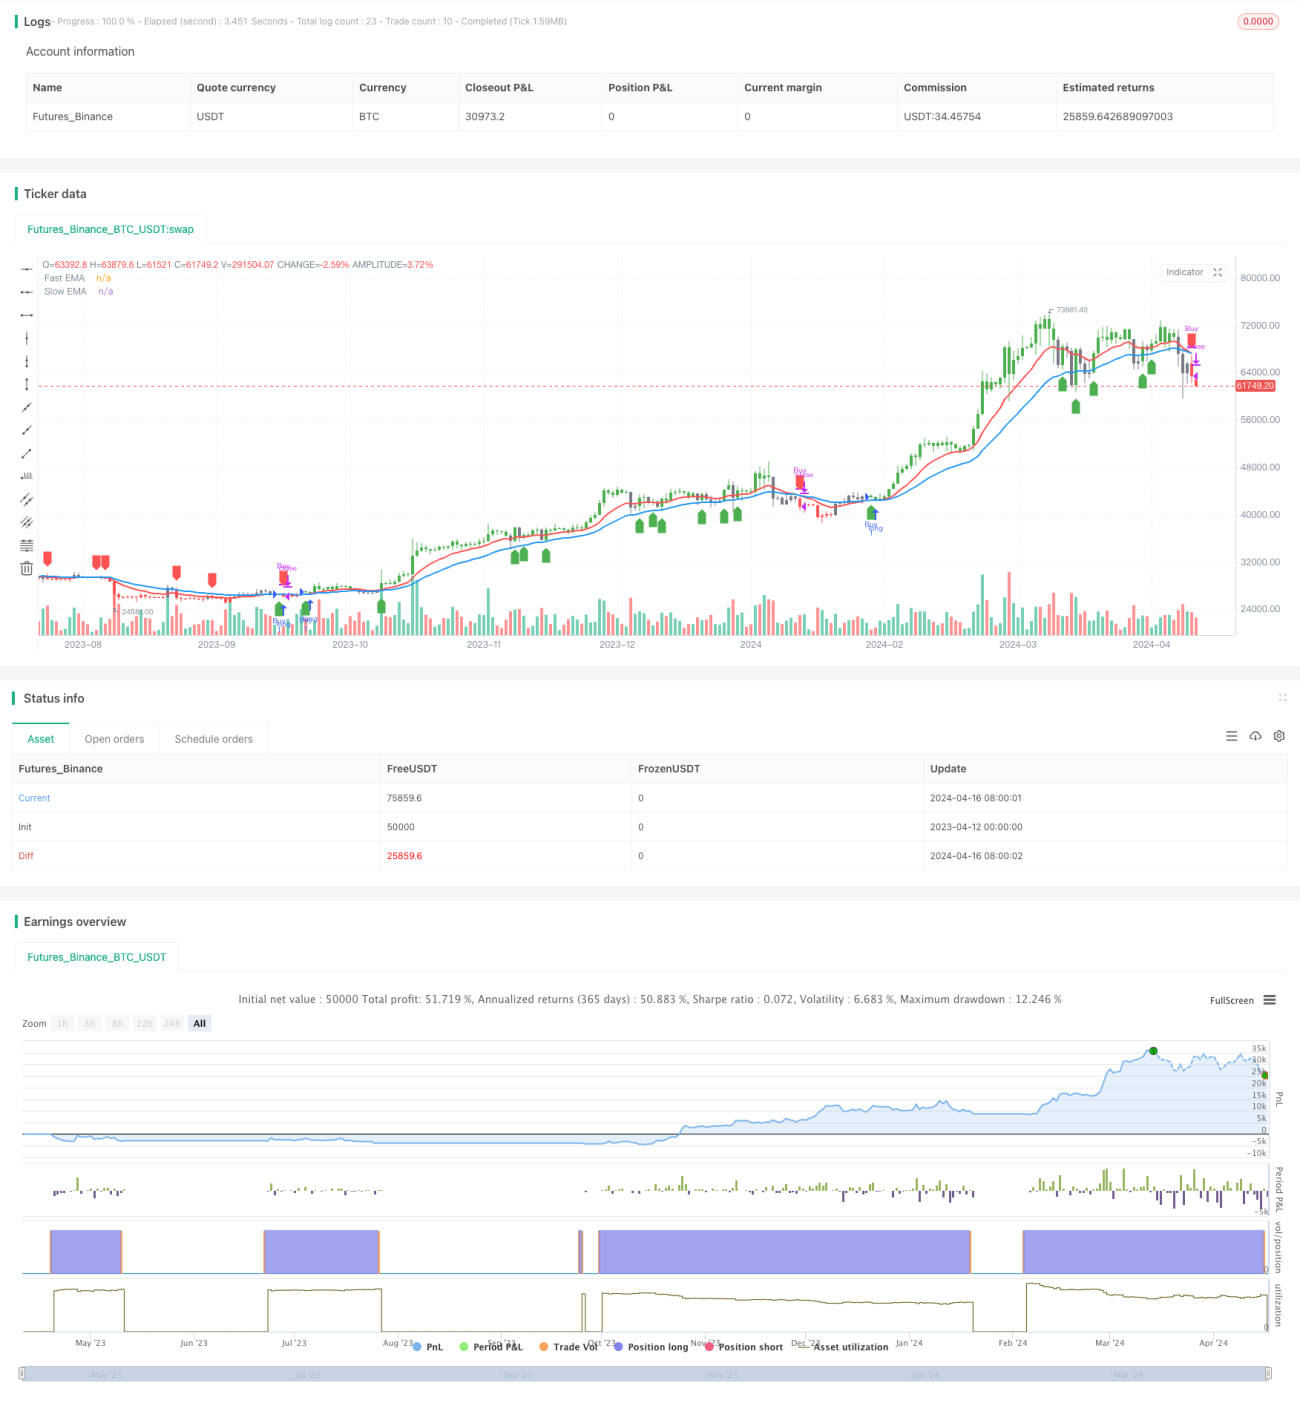
/*backtest
start: 2023-04-12 00:00:00
end: 2024-04-17 00:00:00
period: 1d
basePeriod: 1h
exchanges: [{"eid":"Futures_Binance","currency":"BTC_USDT"}]
*/

//@version=5
strategy('Advance EMA Crossover Strategy', overlay=true, precision=6)
//****************************************************************************//
// CDC Action Zone is based on a simple EMA crossover Strategy parameters
Related strategies
Comment
All comments (0)
No data
- 1