
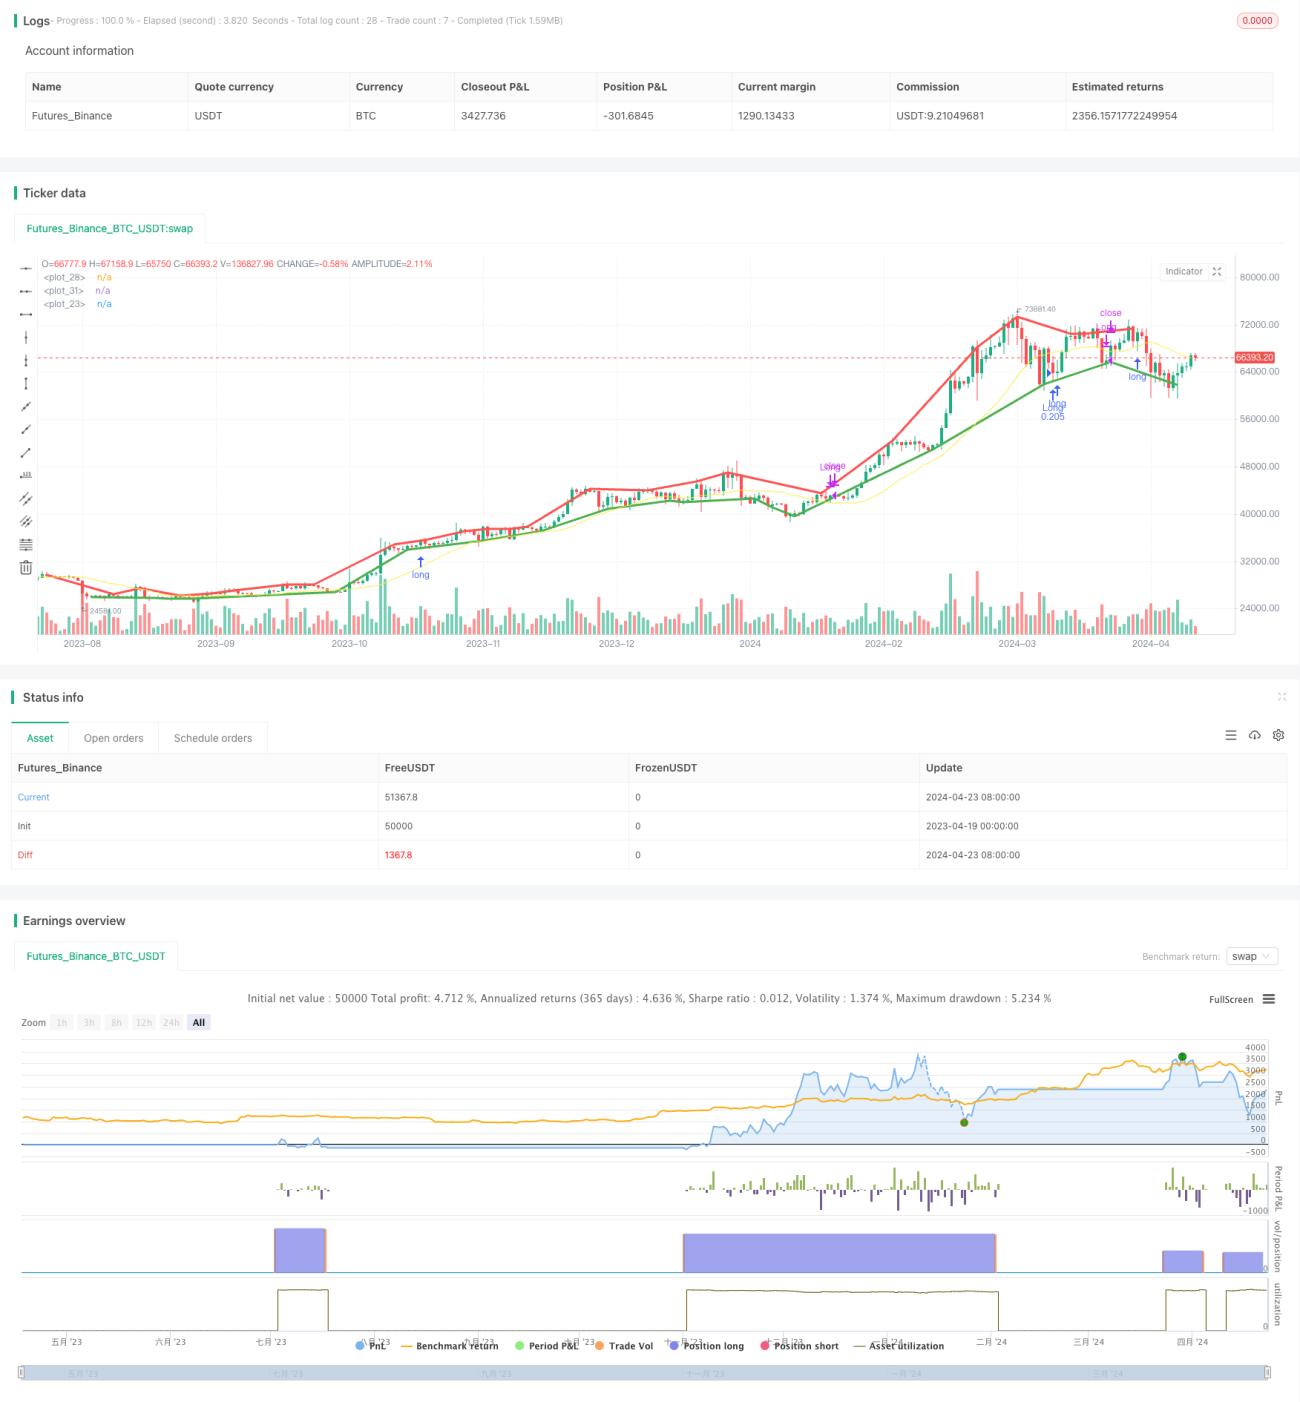
この戦略は,二時間スケールの動量戦略である.これは,上位時間周期で単純な移動平均 ((SMA) を使用してトレンドの方向を判断し,下位時間周期で枢軸ポイント ((PivotLowとPivotHigh) を使用して逆転点を識別する.上位時間周期で上昇傾向があり,下位時間周期で看板枢軸が開くとき,高位時間周期で下降傾向があり,下位時間周期で看板枢軸が開くとき,空いている.
この戦略の主な原理は,上位時間周期のトレンドの方向が下位時間周期の動きに影響するということです.上位時間周期が上昇傾向にあるとき,下位時間周期の回調は買い機会である可能性が高いです.上位時間周期が下位傾向にあるとき,下位時間周期の反転は空き機会である可能性が高いです.この戦略は,単純な移動平均 (SMA) を使用して,上位時間周期のトレンドの方向を判断し,枢軸 (PivotLowとPivotHigh) を使用して,下位時間周期の逆転点を識別します.
この二時間尺度動力の戦略は,高低レベルの時間周期の間のつながりを利用し,高レベルの時間周期でトレンドの方向を判断し,低レベルの時間周期で逆転のポイントをキャプチャすることで,トレンドフォローと逆転取引を実現する.この戦略の論理は明確で,優位性は明らかですが,同時にいくつかのリスクもあります.将来,トレンドの変化を判断し,パラメータ最適化,リスク制御,多因子融合などの面でこの戦略を最適化して,その適応性と安定性を向上させることができます.
/*backtest
start: 2023-04-19 00:00:00
end: 2024-04-24 00:00:00
period: 1d
basePeriod: 1h
exchanges: [{"eid":"Futures_Binance","currency":"BTC_USDT"}]
*/
// This Pine Script™ code is subject to the terms of the Mozilla Public License 2.0 at https://mozilla.org/MPL/2.0/
// © Riester
//@version=5
strategy("Dual Timeframe Momentum", overlay=true, precision=6, pyramiding=0, initial_capital=1000, default_qty_type=strategy.percent_of_equity, default_qty_value=25.0, commission_value=0.05)
n = input.int(20, "Moving Average Period", minval=1)
src = input.source(close, "Source")
high_tf = input.timeframe("240", "Resolution")
pivot_l = input.int(5, "Pivot Let Bars")
pivot_r = input.int(2, "Pivot Right Bars")
//-----------------------------------------------------------------------------------------------------------------------------------------------------------------
// Calculations
//-----------------------------------------------------------------------------------------------------------------------------------------------------------------
// 1. Define low and high timeframe prices
low_src = src
high_src = request.security(syminfo.tickerid, high_tf, src)
// 2. Use simple moving average to determine trend of higher timeframe (up or down)
high_tf_ma = ta.sma(high_src, n)
plot(high_tf_ma, color=color.yellow)
high_tf_trend = high_tf_ma > high_tf_ma[1] ? 1 : -1
// 3. Use pivots to identify reversals on the low timeframe
low_tf_pl = ta.pivotlow(high_src, pivot_l, pivot_r)
plot(low_tf_pl, style=plot.style_line, linewidth=3, color= color.green, offset=-pivot_r)
low_tf_ph = ta.pivothigh(high_src, pivot_l, pivot_r)
plot(low_tf_ph, style=plot.style_line, linewidth=3, color= color.red, offset=-pivot_r)
bool long = low_tf_pl and high_tf_trend == 1
bool short = low_tf_ph and high_tf_trend == -1
//-----------------------------------------------------------------------------------------------------------------------------------------------------------------
// Plots
//-----------------------------------------------------------------------------------------------------------------------------------------------------------------
// this message is an alert that can be sent to a webhook, which allows for simple automation if you have a server that listens to alerts and trades programmatically.
enter_long_alert = '{"side": "Long", "order": "Enter", "price": ' + str.tostring(open) + ', "timestamp": ' + str.tostring(timenow) + '}'
exit_long_alert = '{"side": "Long", "order": "Exit", "price": ' + str.tostring(open) + ', "timestamp": ' + str.tostring(timenow) + '}'
if long
strategy.entry(id="Long", direction=strategy.long, limit=open, alert_message=enter_long_alert)
if short
strategy.close(id="Long", comment="Close Long", alert_message=exit_long_alert)