ボリンジャーバンドブレイクアウト戦略

1
Follow
1781
Followers
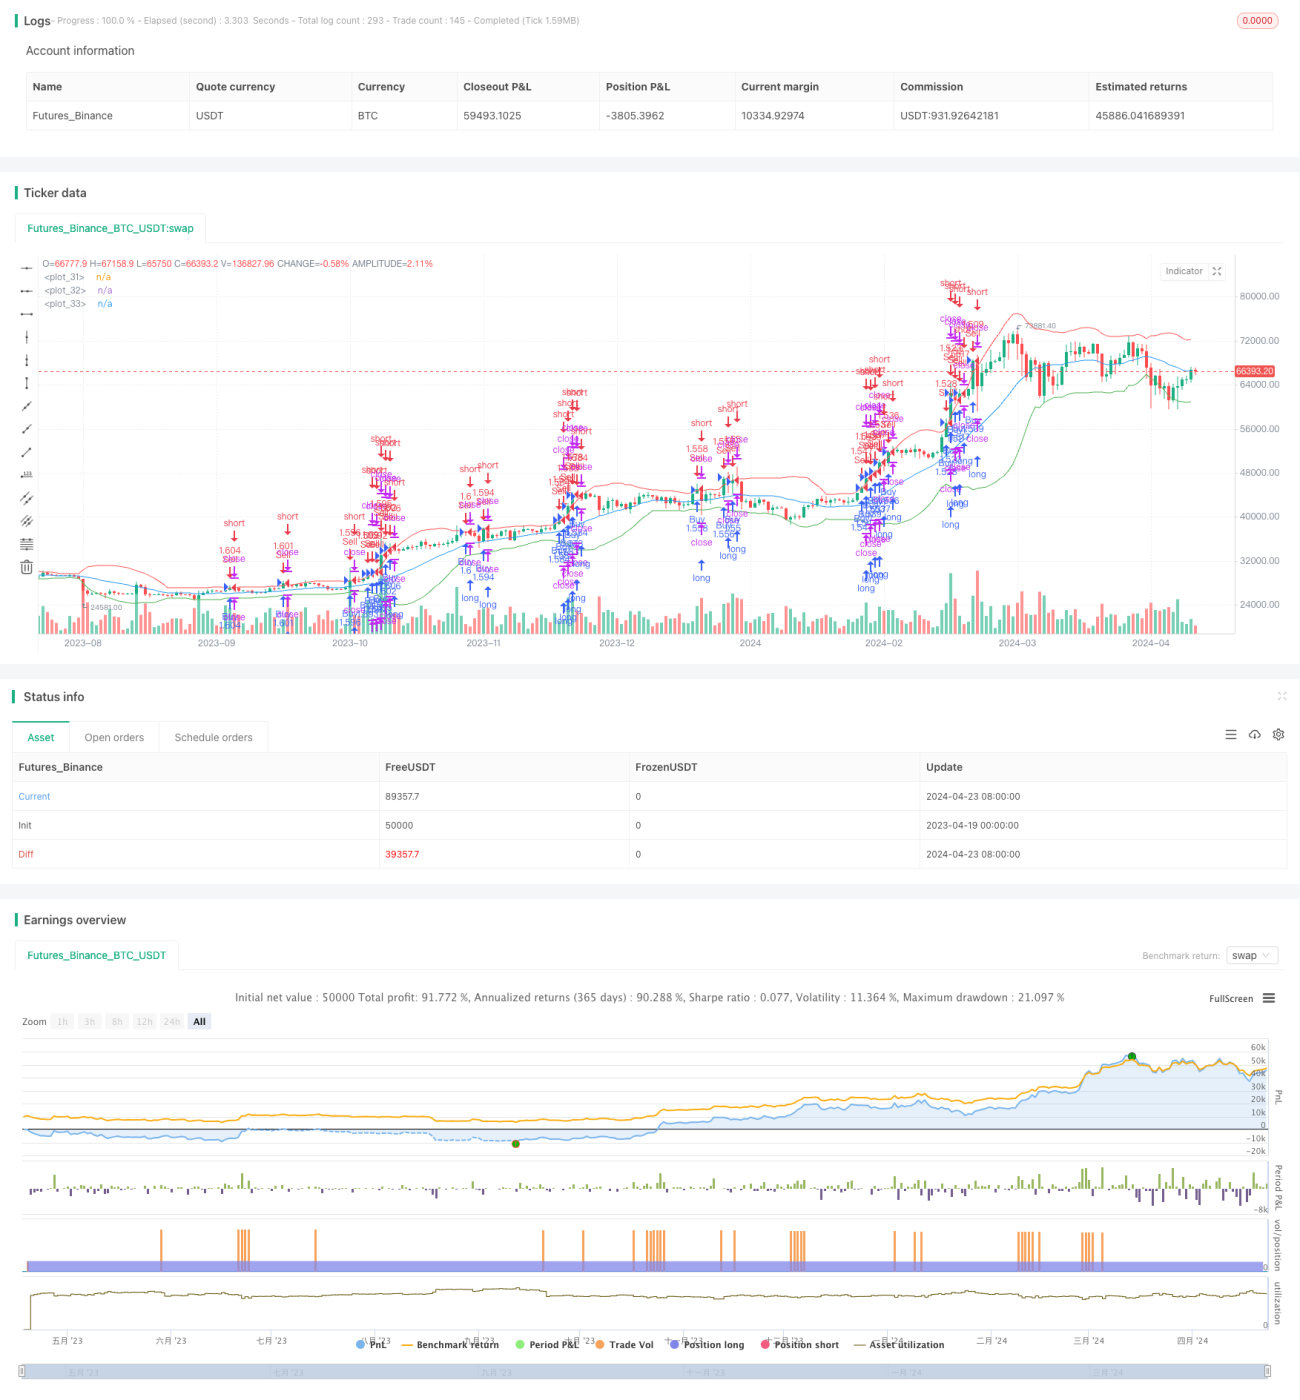
概要
この戦略は,ブリン帯を買賣信号として利用し,価格が下線を突破するときに買い,上線を突破するときに売る.また,ピラミッド式加仓方法を使用し,所持数が設定値を下回ると買い続け,設定値を下回ると売る.この戦略は,明らかに傾向のある市場情勢に適用される.
戦略原則
- ブリン帯の上線,中線,下線を計算する. 中線は収盘価格の単純移動平均で,上下線は中線加減収盘価格の標準差の倍数である.
- 閉店価格が下線以下またはそれと同等であるとき,買入シグナルを生成する.上線以上またはそれと同等であるとき,売り出しシグナルを生成する.
- 現在の保有額が設定されたピラミッド加減額より小さい場合は,購入を続け,設定された額より大きい場合は,売却する.
- ブリン帯の上中下線をグラフに描画する.
戦略的優位性
- ブリン帯は,価格の波動範囲を量化し,明確な買入シグナルを提供し,操作が容易である.
- ピラミッドの加減は,トレンドの利益を増大させる.
- ブリンにはトレンド認識とリスク管理の能力があり,トレンドトレーダーに適しています.
戦略リスク
- 市場が揺れ動いている時,頻繁に買入シグナルが出ると,損失を招く可能性があります.
- ピラミッドの加減は,トレンドが逆転した場合には,下落のリスクを高めます.
- ブリン帯のパラメータの選択は,異なる市場と周期に応じて最適化され,不適切なパラメータは,戦略の失敗につながる可能性があります.
戦略最適化の方向性
- RSI,MACDなどの他の指標と組み合わせて,ブリン帯の信号を二次確認して,信号の正確性を向上させることができる.
- ピラミッドの加仓数と割合を制御し,ストップ・ロスの位置,下落・下落のリスクを設定する.
- ブリン帯のパラメータ,周期,倍数などの最適化テストを行い,最適なパラメータ組み合わせを選択する.
- 震動市ではブリン帯通路戦略を用いて,上下軌道の間を高投げ低吸を行うことが考えられる.
要約する
ブリン帯の突破策は,価格のブリン帯の位置に対してトレンド追跡信号を生成し,同時にピラミッド加仓によってトレンド収益を拡大する.しかし,震動的な市場では不良なパフォーマンスを発揮し,ピラミッド加仓は損失を拡大する可能性がある.したがって,実際の適用では,他の指標の検証信号と組み合わせ,加仓リスクを制御し,パラメータを最適化する必要があります.同時に,市場の特徴に応じて戦略を柔軟に調整する必要があります.
Source
Pine
/*backtest
start: 2023-04-19 00:00:00
end: 2024-04-24 00:00:00
period: 1d
basePeriod: 1h
exchanges: [{"eid":"Futures_Binance","currency":"BTC_USDT"}]
*/

//@version=5
strategy("Bollinger Bands Breakout Strategy", overlay=true, initial_capital=100, default_qty_type=strategy.percent_of_equity, default_qty_value=100)

// Définition des paramètresStrategy parameters
Related strategies
Comment
All comments (0)
No data
- 1