日中スケーラブルボラティリティ取引戦略

[trans]
概要
この戦略は,日内取引に基づく拡張性波動率取引戦略である.これは,波動率,取引量,価格範囲,技術指標および新しい触媒を含む複数の技術指標と市場条件を組み合わせて,潜在的な多頭と空頭取引の機会を探します.この戦略は,ATR指標を使用して,市場の波動率を測定し,波動率の高低さに基づいて取引を行うかどうかを決定します.この戦略は,取引量,価格範囲,技術指標および新しい触媒などの要因も考慮し,取引信号の信頼性を向上します.
戦略原則
この戦略の核心原則は,市場の変動率,取引量,価格範囲,技術指標および新しい触媒などの複数の要因を使用して,市場動向と潜在的な取引機会を総合的に判断することです.具体的には,この戦略は,次のステップを使用して取引シグナルを生成します.
-
ATR指標を計算し,市場の変動率を測定する.現在のATR値が前のATR値の1.2倍以上であるとき,市場は高い変動状態にあることを示している.
-
現在の取引量が50サイクル以上の取引量であるかどうかを判断する取引量のシンプル移動平均.この条件は,取引量の高い場合での取引を保証するために取引の信頼性を高めるために使用される.
-
現在の取引日の価格の範囲 ((最高価格 - 最低価格) を計算し,0.005より大きいかどうかを判断する.この条件は,価格の変動が大きい場合に取引を確実にするために,より多くの潜在的な利益を得るために使用される.
-
2つの単純な移動平均 ((5日目と20日目) を使って市場トレンドを判断する. 5日目の平均線が20日目の平均線より上にあるときは,市場が多頭トレンドにあることを示し,反対に市場が空頭トレンドにあることを示している.
-
新しい触媒が生じたかどうかを判断する.つまり,現在の閉盘価格が開盘価格より高いかどうかを判断する.この条件は,取引の成功率を高めるために,新しい有利な要因が生じたときに取引を確実にするために使用される.
-
上記の条件がすべて満たされた場合,市場の傾向に応じて ((多頭または空頭) が相応の取引シグナルを生成する ((買ったり売ったり) 〜).
-
多頭取引の場合,速平均線の下を通過すると平仓退出;空頭取引の場合,速平均線上を通過すると平仓退出.
戦略的優位性
-
多要素総合判断:この戦略は,市場の変動率,取引量,価格範囲,技術指標,新しい触媒などの複数の要因を総合的に考慮し,市場状況と潜在的な取引機会を全面的に評価し,取引信号の信頼性を向上させます.
-
適応性:ATR指標を使用して市場の変動率を測定することで,この戦略は異なる市場環境に適応できます.変動率が高く,この戦略は市場の変化に対応するために取引条件を自動的に調整します.
-
リスク管理:この戦略は,明瞭な入場・出場条件を設定し,取引リスクを制御するのに役立ちます.また,取引量や価格範囲などの要因を考慮することによって,この戦略は,市場の流動性が不足している場合や過小な変動がある場合での取引を避けるようにし,リスクをさらに低減します.
-
トレンド・トラッキング: 市場のトレンドを判断するために,シンプルな移動平均を使用することで,この戦略は市場の主要な方向を追跡し,トレンドの変化に応じて取引戦略をタイムリーに調整し,取引の正確性を向上させることができます.
-
自動取引:この戦略は,自動取引を実現し,人間の介入と感情の影響を軽減し,取引効率と一致性を向上させる.
戦略リスク
-
パラメータ最適化リスク:この戦略は,ATR周期,波動率因子,交割量SMPE周期など,複数のパラメータに関係している.これらのパラメータの選択は,戦略の性能に重要な影響があり,パラメータの不適切な設定は,戦略の失敗または不良なパフォーマンスを引き起こす可能性がある.したがって,最適のパラメータの組み合わせを見つけるために,パラメータの最適化とテストが必要である.
-
過適合リスク:この戦略は,取引シグナルを生成するために複数の条件を使用し,過適合のリスクがある可能性があります.過適合は,戦略が歴史的データで良好なパフォーマンスを発揮するが,実際の取引では不良なパフォーマンスを発揮する.過適合リスクを減らすために,サンプル外データを使用してテストを行い,戦略の安定性検査を行うことができます.
-
市場リスク:この戦略は,主に傾向が明らかな,波動率が高い市場環境に適用されます.市場の傾向が明らかなか,波動率が低い場合,この戦略のパフォーマンスは影響されることがあります.また,この戦略は,ブラック天候事件や政策変更などの外部要因の影響を受け,これらの要因は,戦略の失敗につながる可能性があります.
-
取引コストリスク:この戦略は,日中の取引戦略であり,取引頻度が高いため,滑りポイント,手数料など,取引コストが高くなる可能性があります.これらのコストは,戦略の利潤を侵食し,戦略の全体的なパフォーマンスを低下させます.したがって,実際のアプリケーションでは,取引コストの影響を考慮し,戦略を相応に最適化する必要があります.
-
流動性リスク:この戦略の取引信号は,取引量,価格範囲などの複数の条件に依存します.市場の流動性が不足している場合,これらの条件が満たされない可能性があり,戦略が有効な取引信号を生成することになります.したがって,この戦略を適用する際には,流動性のある市場と取引標識を選択する必要があります.
最適化の方向
-
動的調整パラメータ: 適応アルゴリズムまたは機械学習の方法を使用することを検討し,異なる市場環境に対応するために,市場の状況の変化に応じて戦略パラメータを自動的に調整し,戦略の安定性と適応性を向上させる.
-
リスク管理策の導入: 潜在的損失を制御するために,戦略にストップ・ロス,ポジション管理などのリスク管理策を導入する. また,波動率調整のポジション管理方法を使用し,市場の波動率の高低の動向に応じてポジションのサイズを調整してリスクを制御する.
-
取引信号の最適化:取引信号の生成を最適化するために,他の技術指標または市場要因,例えば相対的強弱指数 ((RSI),市場情緒指標などの導入を考慮することができます. さらに,機械学習アルゴリズム,例えば支持ベクトルマシン ((SVM),ランダムフォレストなどの使用もできます. 取引信号のトレーニングと最適化のために.
-
ストップ・ストップ・ストップ戦略の改善:現在のストップ・ストップ・ストップ戦略は,出場条件を判断するために単純な移動平均の交差を用い,利益を保護し,リスクを制御するために,トラッキング・ストップ・ストップ,変動率・ストップなど,より複雑なストップ・ストップ・ストップ戦略を導入することを考えることができます.
-
市場微細構造分析への参加: 市場微細構造分析を,注文の流れ,取引の深さなどの分析戦略に組み込むことを検討し,より多くの市場情報を入手し,取引決定の正確性を向上させる.
-
基本的分析を基本的分析と技術的分析と組み合わせ,マクロ経済指標,業界動向,企業の財務データなどの要因を考慮して,より包括的な市場情報を取得し,戦略の信頼性と安定性を向上させる.
要約する
この戦略は,マルチファクター分析に基づいた,日内拡張性波動率取引戦略であり,市場波動率,取引量,価格範囲,技術指標および新しい触媒などの要因を総合的に考慮して,多頭と空頭取引信号を生成する. この戦略の優点は,適応性の高い,リスク管理手段の明快さ,トレンド追跡能力の強いこと,パラメータ最適化,過適合,市場リスク,取引コストおよび流動性などのリスクがあることにある. 戦略の性能と安定性をさらに向上させるために,ダイナミックなパラメータ調整,リスク管理措置,取引信号の最適化,ストップダスト戦略の改善,市場,微細構造分析および基本面分析などの最適化措置を導入することを考慮することができる.
||
Overview
This strategy is an intraday scalable volatility trading strategy based on day trading. It combines multiple technical indicators and market conditions, including volatility, volume, price range, technical indicators, and new catalysts, to identify potential long and short trading opportunities. The strategy uses the ATR indicator to measure market volatility and determines whether to trade based on the level of volatility. At the same time, the strategy also considers factors such as trading volume, price range, technical indicators, and new catalysts to improve the reliability of trading signals.
Strategy Principle
The core principle of this strategy is to use multiple factors such as market volatility, trading volume, price range, technical indicators, and new catalysts to comprehensively judge market trends and potential trading opportunities. Specifically, the strategy uses the following steps to generate trading signals:
-
Calculate the ATR indicator to measure market volatility. When the current ATR value is greater than 1.2 times the previous ATR value, it indicates that the market is in a high volatility state.
-
Determine whether the current trading volume is greater than the simple moving average of the trading volume over 50 periods. This condition is used to ensure that trading is carried out when the trading volume is relatively large, to improve the reliability of trading.
-
Calculate the price range (highest price - lowest price) of the current trading day and determine whether it is greater than 0.005. This condition is used to ensure that trading is carried out when the price fluctuation is relatively large, to obtain more potential profits.
-
Use two simple moving averages (5-day and 20-day) to judge the market trend. When the 5-day average is above the 20-day average, it indicates that the market is in a bullish trend; otherwise, it indicates that the market is in a bearish trend.
-
Determine whether a new catalyst has appeared, that is, whether the current closing price is higher than the opening price. This condition is used to ensure that trading is carried out when there are new favorable factors, to increase the success rate of trading.
-
When all of the above conditions are met, generate corresponding trading signals (buy or sell) according to the market trend (bullish or bearish).
-
For long trades, when the fast moving average crosses below the slow moving average, close the position and exit; for short trades, when the fast moving average crosses above the slow moving average, close the position and exit.
Strategy Advantages
-
Comprehensive multi-factor judgment: The strategy comprehensively considers multiple factors such as market volatility, trading volume, price range, technical indicators, and new catalysts, which can comprehensively evaluate market conditions and potential trading opportunities, and improve the reliability of trading signals.
-
Strong adaptability: By using the ATR indicator to measure market volatility, the strategy can adapt to different market environments. When volatility is high, the strategy automatically adjusts trading conditions to cope with market changes.
-
Risk control: The strategy sets clear entry and exit conditions, which helps to control trading risks. At the same time, by considering factors such as trading volume and price range, the strategy can avoid trading when market liquidity is insufficient or volatility is too small, further reducing risks.
-
Trend tracking: By using simple moving averages to judge market trends, the strategy can track the main direction of the market and adjust trading strategies in a timely manner according to changes in trends, improving the accuracy of trading.
-
Automated trading: The strategy can achieve automated trading, reducing human intervention and emotional impact, and improving trading efficiency and consistency.
Strategy Risks
-
Parameter optimization risk: The strategy involves multiple parameters, such as the ATR period, volatility factor, simple moving average period of trading volume, etc. The selection of these parameters has an important impact on strategy performance, and improper parameter settings may lead to strategy failure or poor performance. Therefore, it is necessary to optimize and test the parameters to find the best parameter combination.
-
Overfitting risk: The strategy uses multiple conditions to generate trading signals, which may have the risk of overfitting. Overfitting may cause the strategy to perform well on historical data but perform poorly in actual trading. To reduce the risk of overfitting, out-of-sample data can be used for testing and robustness testing of the strategy.
-
Market risk: The strategy is mainly applicable to market environments with obvious trends and high volatility. When market trends are not obvious or volatility is low, the performance of the strategy may be affected. In addition, the strategy is also affected by external factors such as black swan events and policy changes, which may cause the strategy to fail.
-
Transaction cost risk: The strategy is an intraday trading strategy with a high trading frequency, which may generate high transaction costs, such as slippage and commission. These costs will erode the profits of the strategy and reduce the overall performance of the strategy. Therefore, in practical applications, it is necessary to consider the impact of transaction costs and optimize the strategy accordingly.
-
Liquidity risk: The trading signals of the strategy depend on multiple conditions, such as trading volume, price range, etc. In the case of insufficient market liquidity, these conditions may not be met, resulting in the strategy not being able to generate effective trading signals. Therefore, when applying the strategy, it is necessary to select markets and trading targets with good liquidity.
Optimization Direction
-
Dynamic parameter adjustment: Consider using adaptive algorithms or machine learning methods to automatically adjust strategy parameters according to changes in market conditions, to adapt to different market environments and improve the robustness and adaptability of the strategy.
-
Introduce risk management measures: Introduce risk management measures in the strategy, such as stop loss and position management, to control potential losses. At the same time, consider using volatility-adjusted position management methods to dynamically adjust position size according to the level of market volatility to control risk.
-
Optimize trading signals: Consider introducing other technical indicators or market factors, such as the Relative Strength Index (RSI), market sentiment indicators, etc., to optimize the generation of trading signals. In addition, machine learning algorithms such as support vector machines (SVM) and random forests can be used to train and optimize trading signals.
-
Improve stop-profit and stop-loss strategies: At present, the strategy uses simple moving average crossover to determine exit conditions. More complex stop-profit and stop-loss strategies, such as trailing stop loss and volatility stop loss, can be considered to better protect profits and control risks.
-
Incorporate market microstructure analysis: Consider incorporating market microstructure analysis into the strategy, such as analyzing order flow, order book depth, etc., to obtain more market information and improve the accuracy of trading decisions.
-
Combine fundamental analysis: Combine fundamental analysis with technical analysis, considering factors such as macroeconomic indicators, industry trends, company financial data, etc., to obtain more comprehensive market information and improve the reliability and robustness of the strategy.
Summary
This strategy is an intraday scalable volatility trading strategy based on multi-factor analysis, which generates long and short trading signals by comprehensively considering factors such as market volatility, trading volume, price range, technical indicators, and new catalysts. The advantages of the strategy are strong adaptability, clear risk control measures, and strong trend tracking ability. At the same time, there are
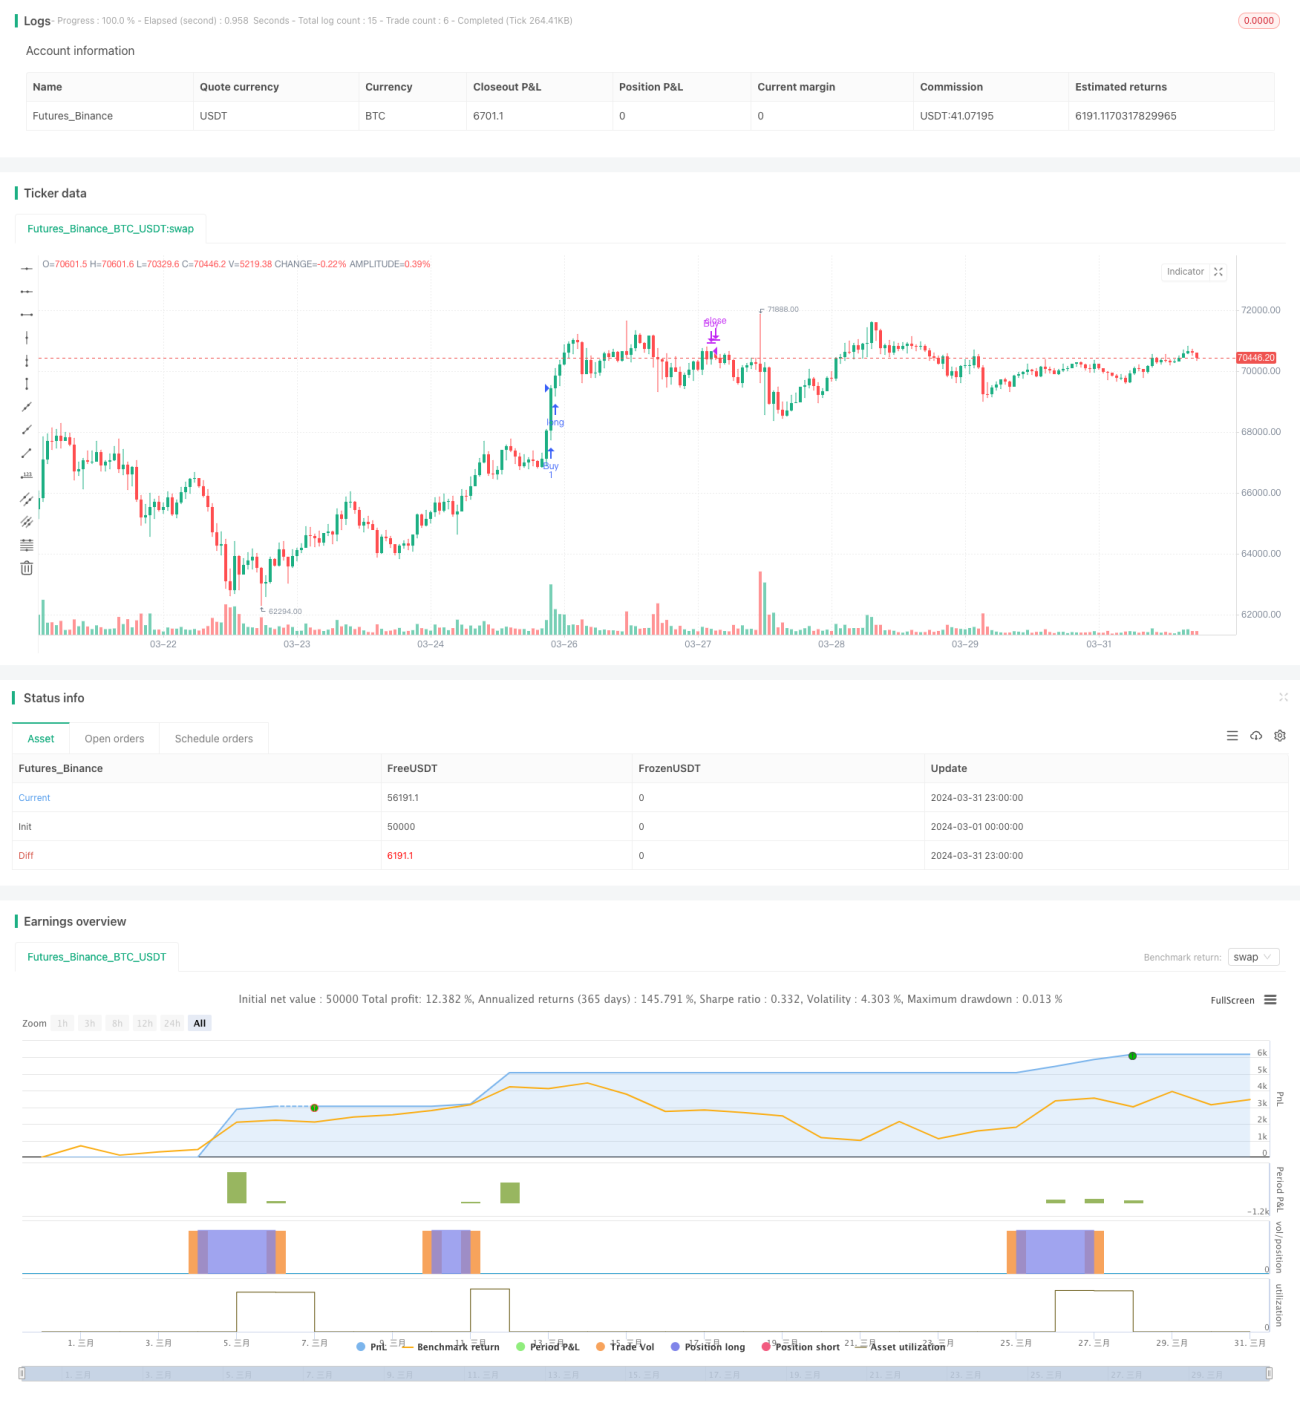
/*backtest
start: 2024-03-01 00:00:00
end: 2024-03-31 23:59:59
period: 1h
basePeriod: 15m
exchanges: [{"eid":"Futures_Binance","currency":"BTC_USDT"}]
*/

//@version=4
strategy("Intraday Scalping Strategy with Exit Conditions", shorttitle="ISS", overlay=true)

// Define Volatility based on ATR for intraday- 1