RSIとダブルEMAクロスオーバーシグナル定量戦略

1
Follow
1788
Followers
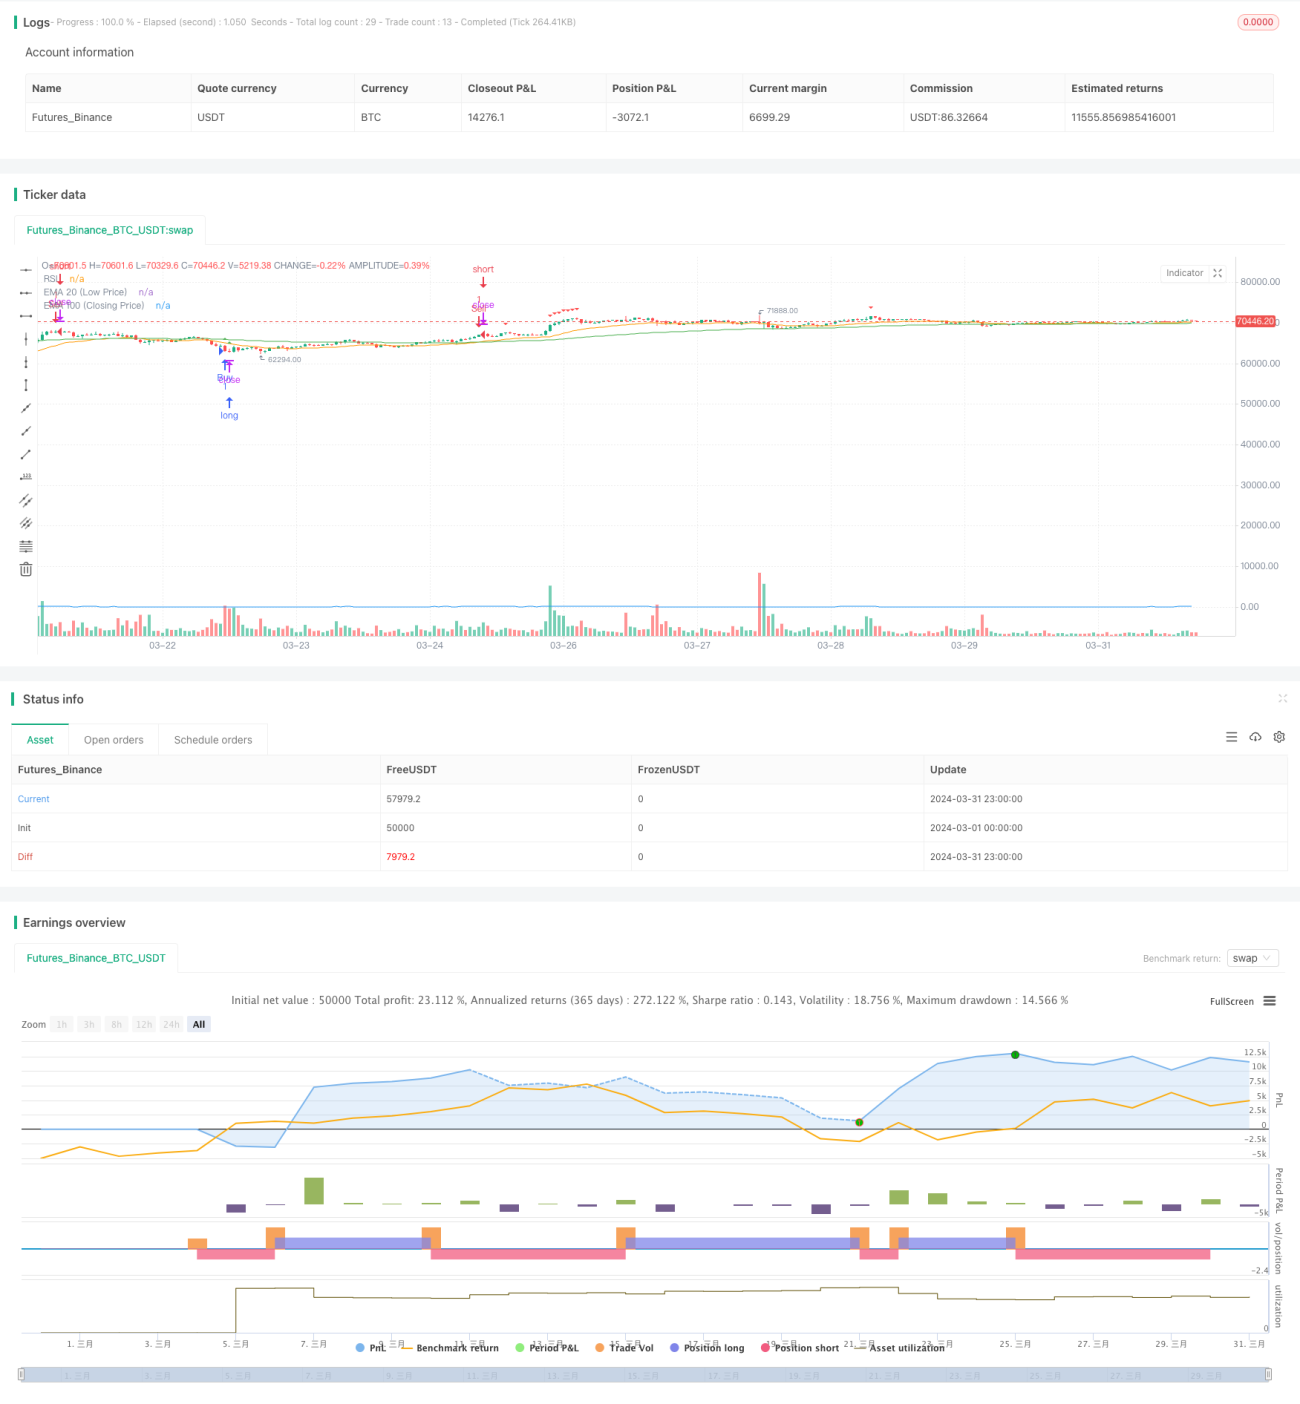
概要
この戦略は,RSI指数と2つのEMA線の交差信号に基づいて,買出点を判断する. 閉盘価格がEMA100とEMA20を下回り,RSI値が30を下回ったときに買入シグナルを生成する. 閉盘価格がEMA100とEMA20を破り,RSI値が70を超えたときに売り出しシグナルを生成する. この戦略の主な考え方は,RSI指数を使用して,超超買出状況を判断し,EMA線のトレンド判断と組み合わせて,市場の波動的な低点と高点を捕捉するために,低値と高値のポーリング操作を行う.
戦略原則
- RSI指標の値を計算し,市場の超買超売り状況を判断する. RSIが30を下回ると超売り区間とみなされ,70を超えると超買区間とみなされる.
- EMA100の閉店価格とEMA20の最低価格の2つの平均線を計算し,トレンド判断の基礎として使用する.
- EMA100とEMA20を下回り,RSI値が30を下回ると,超売れと判断し,下向きにトレンドし,買取シグナルを生成する.
- 閉盤価格がEMA100とEMA20を突破し,RSI値が70を超えると,超買いと上昇傾向として判断され,売り込みシグナルが発生します.
- 買って信号が鳴った時に多額のポジションを開け,売って信号が鳴った時に平仓を立てる.
優位分析
- RSI指標とEMA平均線を組み合わせると,トレンドのターニングや超買い超売りのタイミングをよく判断し,誤った信号を減らすことができます.
- パラメータは調整可能で,異なる基準と周期に応じて最適化され,一定の適応性と柔軟性がある.
- 論理はシンプルで明快で,理解し,実行しやすい. 技術分析の基礎はあまり必要ありません.
- 市場が揺れ動いている時に使うため,波動の高低点を把握し,価格差から利益を得ることができます.
リスク分析
- 単一トレンドの場合は,トレンドが形成された後に誤った信号が連続して発生し,<unk>が閉じられる.
- パラメータが固定され,市場にダイナミックに適応する能力が欠如し,市場のリズムの変化に容易に影響される.
- 波動的な状況下での頻繁な取引は,大きな滑点と手数料を生じさせ,戦略的利益に影響を与える可能性があります.
- ポジション管理とリスク管理の欠如,取り戻しと最大損失の制御不能.
最適化の方向
- 傾向判断条件 (MA 越え,DMI など) を加え,一方的な傾向に早めに入場して被套を避ける.
- RSIとEMAのパラメータを最適化して,最も適した基準と周期のパラメータの組み合わせを見つけ,信号の正確性を向上させる.
- ATRポジションやケリー公式などのポジション管理モデルを導入し,取引毎の資金割合を制御し,リスクを軽減する.
- 固定パーセントのストップや移動ストップなどのストップとストップ条件を設定し,単一取引の最大損失と利益の回転を制御します.
- MACD,ブリン帯などの他の補助指標と組み合わせて,信号確認度を高め,誤判を減らす.
要約する
RSIと双EMAの交差信号の量化戦略は,RSI指標とEMA均線を組み合わせることで,波動的な状況の高低点をよりうまく捕捉して差差分レバレッジを行う簡単な実用的な量化取引戦略である.しかし,この戦略には,トレンドの状況下での失敗,ポジション管理とリスク管理の欠如などのいくつかの制限とリスクがあります.したがって,実際のアプリケーションでは,戦略の安定性と収益性を高めるために,市場の特徴と個人の好みに応じて適切な最適化と改善が必要になります.この戦略は,量化取引の入門戦略として学び,使用できます.しかし,慎重に,厳格なリスク管理が必要です.
Source
Pine
Strategy parameters
Related strategies
Comment
All comments (0)
No data
- 1