
“ヴェガス・スーパートレンド・エンハンスド・ストラテジー”は,ヴェガス・チャネルとスーパートレンド・インジケーターを組み合わせた革新的な取引戦略で,スーパートレンド・インジケーターの感性を動的に調整することで,異なる市場の変動状況に適応する.この戦略は,ヴェガス・チャネルを使用して市場の変動を測定し,その基礎でスーパートレンド・インジケーターのパラメータを調整して,トレンドを追跡しながら,市場の変化によりうまく適応する.この戦略は,価格とスーパートレンド・インジケーターの相対的な位置に応じて,買入と出荷のシグナルを生成し,柔軟な取引方向の選択を提供し,多頭,空頭または双方向の取引が可能である.この戦略は,視覚的に優れた効果があり,多頭と空頭を識別するために簡潔な緑色と赤色の標識を使用し,トレーダーが市場動向を迅速に把握できるようにする.
この戦略の核心は,ベガスチャネルとスーパートレンド指標の組み合わせである.ベガスチャネルは,価格の上下波動の範囲を決定するために,シンプルな移動平均 ((SMA)) と標準差 ((STDEV)) を使用する.チャネルの幅は,市場の波動の程度を反映する.スーパートレンド指標は,現在の価格と指標の値の相対的な位置を比較してトレンドの方向を判断するトレンド追跡指標である.
戦略は,ベガスのチャネルの幅の変化に適応するためにSuperTrend指標の倍数を動的に調整します.ベガスのチャネルが広い場合 (つまり,市場の変動が大きい場合),SuperTrend指標の倍数は相応に大きくなり,傾向の変化に敏感になります.逆に,ベガスのチャネルが狭い場合 (つまり,市場の変動が少ない場合),倍数は小さくなるので,指標はより安定して健全になります.この動的調整は,SuperTrend指標を異なる市場のリズムに適応させることができます.
取引シグナルの生成は,現在の閉盤価格とスーパートレンド指標値の比較に基づいています.価格が下から上に向かってスーパートレンド指標ラインを横切るとき,多行シグナルは生成されます.逆に,価格が上から下に向かって指標ラインを横切るとき,空行シグナルは生成されます.このシンプルで直感的なシグナルの判断方法は,この戦略を容易に理解し,適用します.
市場の変動に動的に適応する:ベガスチャネルを通じてスーパートレンド指数のパラメータを動的に調整することで,異なる市場の変動に適応し,トレンドのある市場ではタイムリーにトレンドを捉え,揺れのある市場では安定性を保つことができます.
簡潔で直感的な取引信号:戦略は,価格とSuperTrend指標の相対的な位置に基づいて明確な買入シグナルを生成し,簡単に理解し,トレーダーが迅速な決定を下すのに役立ちます.
柔軟な取引方向の選択:戦略は,異なるトレーダーのニーズと市場見解に対応するために,多頭,空頭,双方向の取引の3つの選択肢を提供します.
優れたビジュアルアシスト:戦略は,緑と赤で多頭と空頭トレンドを図に表示し,矢印で買出点をマークし,直観的にわかりやすく,市場の脈動を把握します.
トレンド認識遅延:すべてのトレンド追跡戦略と同様に,この戦略はトレンド転換の初期にシグナル遅延が発生し,最適な入場時間を逃すか,または追加のリスクを負う可能性があります.
パラメータ設定は敏感である.戦略のパフォーマンスは,ATR周期,ベガスの通路長さなど,パラメータの選択に一定程度依存する.異なるパラメータは,異なる結果をもたらす可能性がある.
頻繁に取引: 戦略はトレンドの変化に敏感であり,波動的な市場で頻繁に取引シグナルを生じ,取引コストと撤回リスクを増加させる可能性があります.
より多くの指標を導入:RSI,MACDなどの他の技術指標を導入することを検討し,トレンド信号を多次元で検証し,信号の信頼性を向上させる.
入場と出場ルールを最適化:現在の入場信号に基づいて,偽信号を減らすために,連続したK線の閉盘価格がトレンド方向に維持されることを要求するなど,より多くのフィルタリング条件を導入することができます.同時に,移動ストップまたは波動率ストップなどを設定して出場を最適化することができます.
動的調整ポジション:市場トレンドの強さ,波動率などの指標に基づいて,動的に取引のポジションを調整し,トレンドが強ければポジションを高め,トレンドが弱くなったらポジションを減らし,リスクをよりよく制御し,利益を最適化します.
“ヴェガス・スーパートレンド・エンハンスド・ストラテジー” (Vegas SuperTrend Enhanced Strategy) は,ヴェガス・チャネルの動的調整によるスーパートレンド指標によって,トレンド識別と市場適応の有機的な組み合わせを実現する革新的なトレンド追跡取引戦略である. 戦略取引の信号は明確で,適応性が強く,視覚的補助効果が優れているが,同時にトレンド識別の遅れ,パラメータセンシビリティなどの固有のリスクにも直面している.
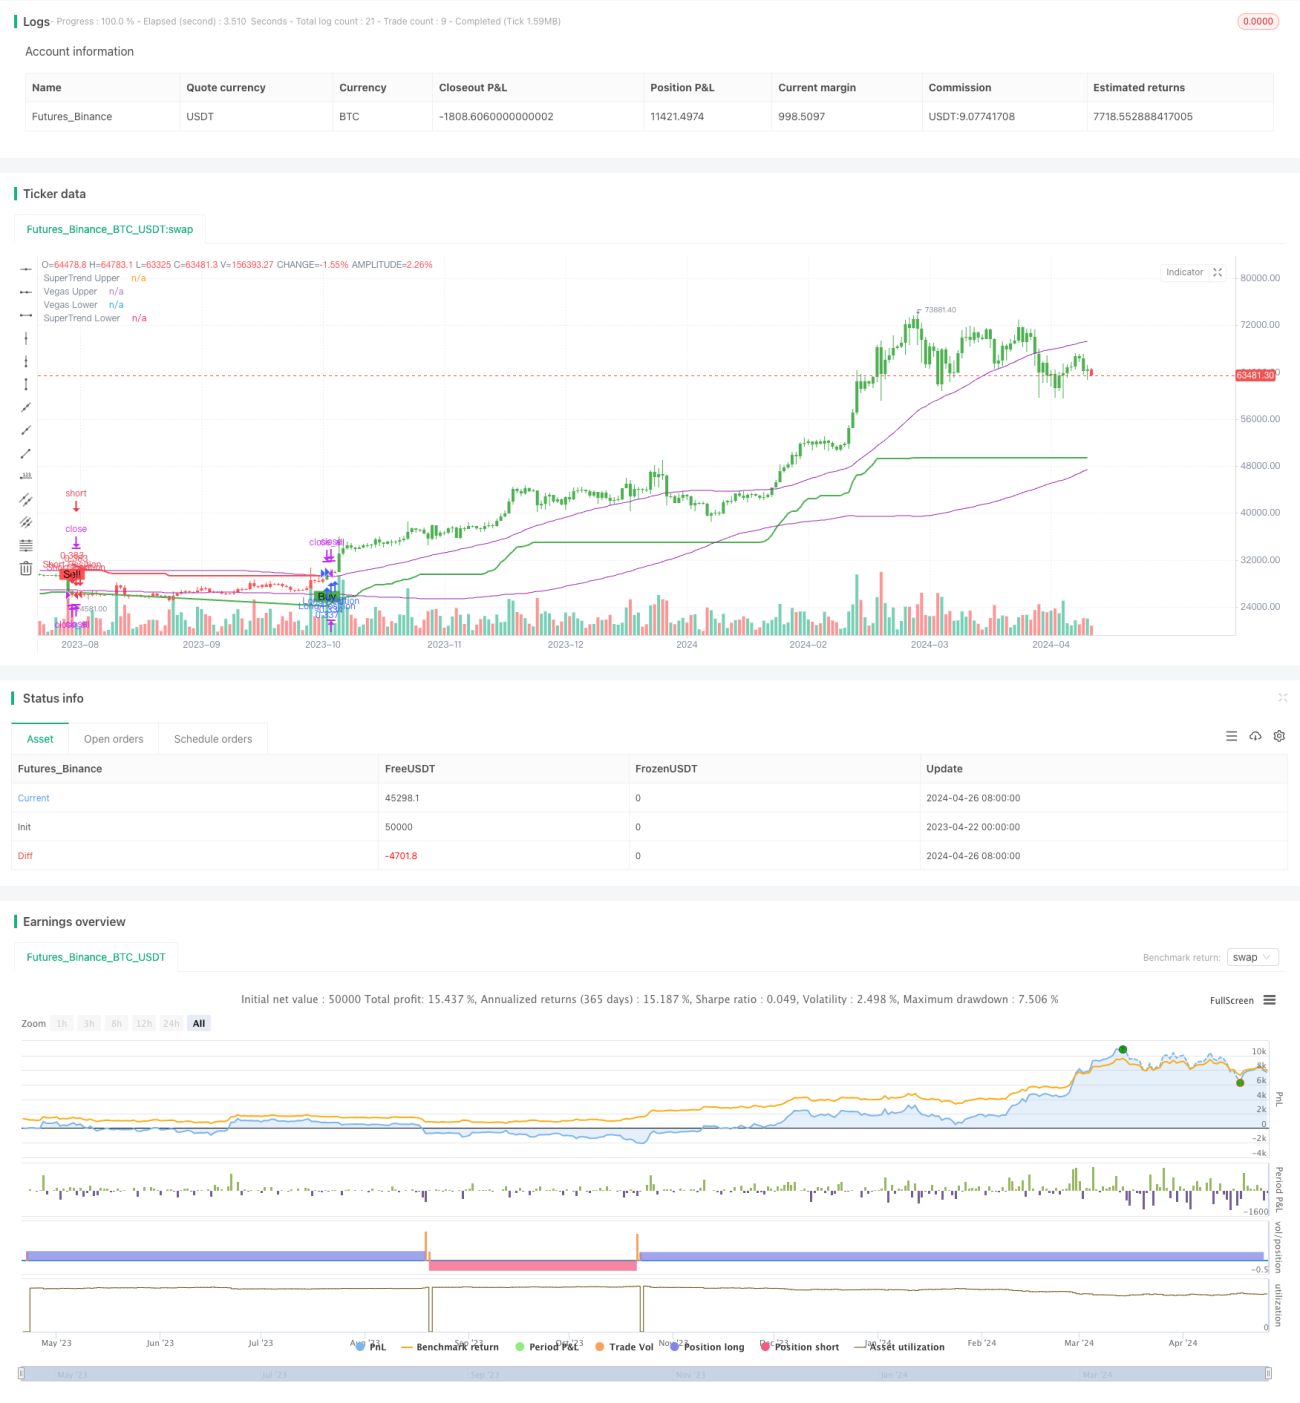
/*backtest
start: 2023-04-22 00:00:00
end: 2024-04-27 00:00:00
period: 1d
basePeriod: 1h
exchanges: [{"eid":"Futures_Binance","currency":"BTC_USDT"}]
*/
// This Pine Script™ code is subject to the terms of the Mozilla Public License 2.0 at https://mozilla.org/MPL/2.0/
// © PresentTrading
// The "Vegas SuperTrend Strategy" uses Vegas Channel and SuperTrend indicators on trading charts, allowing for adjustable settings like ATR length and channel size.
// It modifies the SuperTrend's sensitivity to market volatility, generating buy (green) or sell (red) signals upon trend shifts.
// Entry and exit points are visually marked, with the strategy automating trades based on these trend changes to adapt to different market conditions.
//@version=5
strategy("Vegas SuperTrend Enhanced - strategy [presentTrading]", shorttitle="Vegas SuperTrend Enhanced - strategy [presentTrading]", overlay=true, precision=3, default_qty_type=strategy.cash,
commission_value=0.1, commission_type=strategy.commission.percent, slippage=1, currency=currency.USD, default_qty_value=10000, initial_capital=10000)
// Input settings allow the user to customize the strategy's parameters.
tradeDirectionChoice = input.string(title="Trade Direction", defval="Both", options=["Long", "Short", "Both"]) // Option to select the trading direction
atrPeriod = input(10, "ATR Period for SuperTrend") // Length of the ATR for volatility measurement
vegasWindow = input(100, "Vegas Window Length") // Length of the moving average for the Vegas Channel
superTrendMultiplier = input(5, "SuperTrend Multiplier Base") // Base multiplier for the SuperTrend calculation
volatilityAdjustment = input.float(5, "Volatility Adjustment Factor") // Factor to adjust the SuperTrend sensitivity to the Vegas Channel width
// Calculate the Vegas Channel using a simple moving average and standard deviation.
vegasMovingAverage = ta.sma(close, vegasWindow)
vegasChannelStdDev = ta.stdev(close, vegasWindow)
vegasChannelUpper = vegasMovingAverage + vegasChannelStdDev
vegasChannelLower = vegasMovingAverage - vegasChannelStdDev
// Adjust the SuperTrend multiplier based on the width of the Vegas Channel.
channelVolatilityWidth = vegasChannelUpper - vegasChannelLower
adjustedMultiplier = superTrendMultiplier + volatilityAdjustment * (channelVolatilityWidth / vegasMovingAverage)
// Calculate the SuperTrend indicator values.
averageTrueRange = ta.atr(atrPeriod)
superTrendUpper = hlc3 - (adjustedMultiplier * averageTrueRange)
superTrendLower = hlc3 + (adjustedMultiplier * averageTrueRange)
var float superTrendPrevUpper = na
var float superTrendPrevLower = na
var int marketTrend = 1
// Update SuperTrend values and determine the current trend direction.
superTrendPrevUpper := nz(superTrendPrevUpper[1], superTrendUpper)
superTrendPrevLower := nz(superTrendPrevLower[1], superTrendLower)
marketTrend := close > superTrendPrevLower ? 1 : close < superTrendPrevUpper ? -1 : nz(marketTrend[1], 1)
superTrendUpper := marketTrend == 1 ? math.max(superTrendUpper, superTrendPrevUpper) : superTrendUpper
superTrendLower := marketTrend == -1 ? math.min(superTrendLower, superTrendPrevLower) : superTrendLower
superTrendPrevUpper := superTrendUpper
superTrendPrevLower := superTrendLower
// Enhanced Visualization
// Plot the SuperTrend and Vegas Channel for visual analysis.
plot(marketTrend == 1 ? superTrendUpper : na, "SuperTrend Upper", color=color.green, linewidth=2)
plot(marketTrend == -1 ? superTrendLower : na, "SuperTrend Lower", color=color.red, linewidth=2)
plot(vegasChannelUpper, "Vegas Upper", color=color.purple, linewidth=1)
plot(vegasChannelLower, "Vegas Lower", color=color.purple, linewidth=1)
// Apply a color to the price bars based on the current market trend.
barcolor(marketTrend == 1 ? color.green : marketTrend == -1 ? color.red : na)
// Detect trend direction changes and plot entry/exit signals.
trendShiftToBullish = marketTrend == 1 and marketTrend[1] == -1
trendShiftToBearish = marketTrend == -1 and marketTrend[1] == 1
plotshape(series=trendShiftToBullish, title="Enter Long", location=location.belowbar, color=color.green, style=shape.labelup, text="Buy")
plotshape(series=trendShiftToBearish, title="Enter Short", location=location.abovebar, color=color.red, style=shape.labeldown, text="Sell")
// Define conditions for entering long or short positions, and execute trades based on these conditions.
enterLongCondition = marketTrend == 1
enterShortCondition = marketTrend == -1
// Check trade direction choice before executing trade entries.
if enterLongCondition and (tradeDirectionChoice == "Long" or tradeDirectionChoice == "Both")
strategy.entry("Long Position", strategy.long)
if enterShortCondition and (tradeDirectionChoice == "Short" or tradeDirectionChoice == "Both")
strategy.entry("Short Position", strategy.short)
// Close all positions when the market trend changes.
if marketTrend != marketTrend[1]
strategy.close_all()