
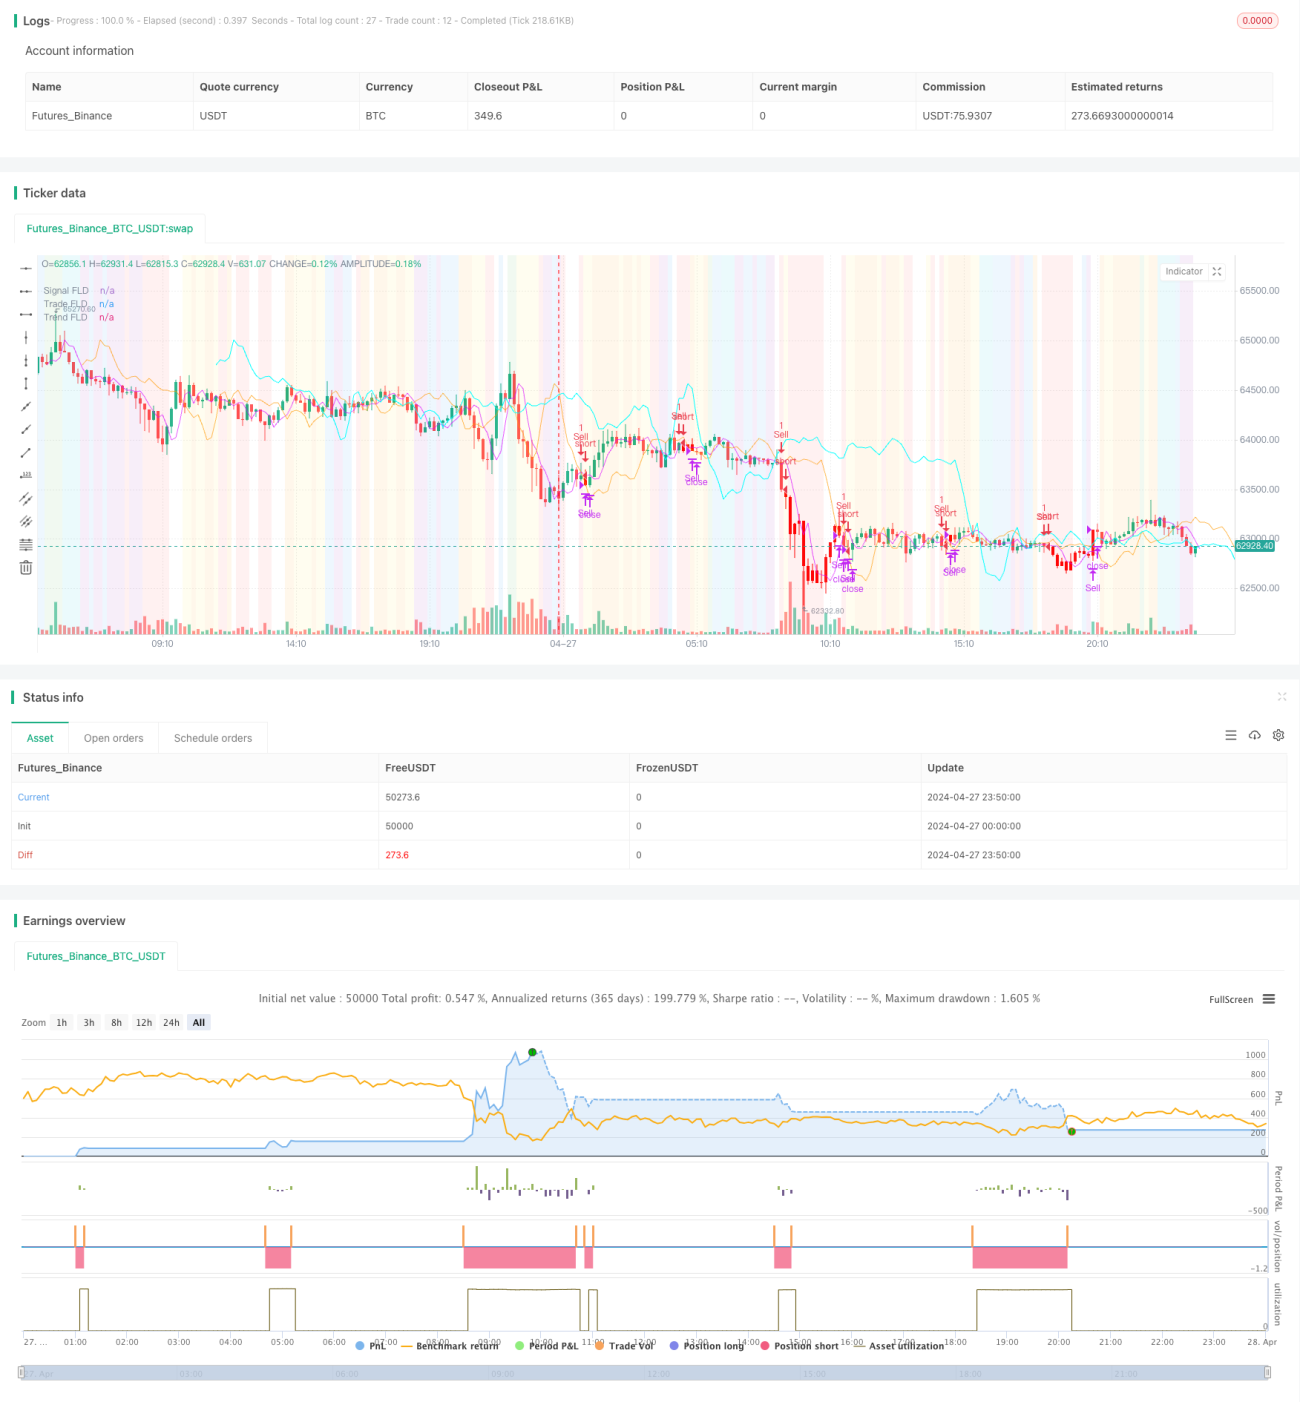
ハーストの未来境界線戦略は,J.M. ハーストが1970年代に提唱した未来境界線 (Future Line of Demarcation,FLD) の概念に基づく取引戦略である.この戦略は,財務図に単純な,しかし深い意味を持つ線を描き,すなわち,価格データをタイム軸で半サイクル前に偏移して,将来の価格動きを予測する.具体的には,この戦略は,主に3つのハースト周期:シグナル周期,取引周期,トレンド周期の相互作用に焦点を当てている.価格とFLDの線との交差および偏離パターンを観察することにより,トレーダーは,市場の傾向または収束を判断し,出口を決定することができます.
ハーストの未来境界線戦略の核心は,価格データを時間軸で半サイクル前に偏移させ,未来境界線を構成することである.例えば,40日周期の場合,FLDは,現在の価格データをグラフで20日前に移動することによって表現される.この戦略は,主に3つのハースト周期を重視する.信号周期 (20日),取引周期 (20日),トレンド周期 (80日).価格が3つのFLDラインと交差し,偏離するパターンを観察することによって,トレーダーは市場の傾向または収束を判断することができる.価格がFLD信号の上方,FLD信号はFLD上で取引され,FLDはトレンドの上方であるとき,市場は上昇傾向にある.
ハーストの”未来における境界線戦略”の主な利点は,
ハーストの”未来境界線”戦略には利点がありますが,いくつかの潜在的なリスクがあります.
これらのリスクを軽減するために,トレーダーはパラメータの最適化,異なる市場条件に合わせて戦略の調整,適切なストップ・ロスとリスク管理の設定を検討することができます.
ハーストの将来的な境界線戦略は,以下の点で最適化できる:
これらの最適化により,ハストの将来の境界線戦略は,異なる市場環境により良く適応し,安定性と収益性を向上させることができます.
ハーストの未来区画策は,J.M. ハーストの未来区画概念に基づいた革新的な取引戦略である.価格データを半サイクル前方に偏移して,未来区画を構築し,3つの異なるハースト周期 (信号周期,取引周期,トレンド周期) を組み合わせることで,この戦略は将来の価格動きの予測を提供します.トレーダーは,FLDラインとの交差と偏差のパターンを観察して,市場の傾向や整合を判断し,出口を決定することができます.この戦略は,簡単で分かりやすく,前向きで多周期的な分析などの利点があるものの,パラメータの感受性,市場の適応性および遅滞などの潜在的なリスクもあります.
/*backtest
start: 2024-04-27 00:00:00
end: 2024-04-28 00:00:00
period: 10m
basePeriod: 1m
exchanges: [{"eid":"Futures_Binance","currency":"BTC_USDT"}]
*/
// This source code is subject to the terms of the Mozilla Public License 2.0 at https://mozilla.org/MPL/2.0/
// © BarefootJoey
//@version=5
strategy("Hurst Future Lines of Demarcation Strategy", overlay=true)
// FLD Settings
source = input(ohlc4, 'Source')
smoothFLD = input.bool(false, 'Smooth FLD')
FLDtransp = input(33, 'FLD transparency')
FLDsmooth = input.int(5, "FLD Smoothing", minval=1, tooltip="Number of trading days to smooth the FLD")
FLD_out = ta.sma(source , smoothFLD ? FLDsmooth : 1)
close_buy_in_1 = input.string('Price', 'Input Close Trigger 1', options=['Price', 'Signal', 'Trade', 'Trend', 'None'])
close_buy_in_2 = input.string('Trade', 'Input Close Trigger 2', options=['Price', 'Signal', 'Trade', 'Trend', 'None'])
// Quarter Cycle (Default: 20 day) Length Pivot Cycle
col_q = input.color(#da00ff, "Quarter Cycle Color")
cyc_q = input.int(5, "Signal Cycle Length")
plot(FLD_out, color=color.new(col_q, FLDtransp), title='Signal FLD', offset = math.round(cyc_q/2) )
// Trade Cycle (Default: 20 day) Length Pivot Cycle
col = input.color(#ff9800, "Trade Cycle Color")
cyc = input.int(20, "Trade Cycle Length")
plot(FLD_out, color=color.new(col, FLDtransp), title='Trade FLD', offset = math.round(cyc/2) )
// Double Cycle (Default: 80 day) Length Pivot Cycle
col_d = input.color(color.aqua, "Double Cycle Color")
cyc_d = input.int(80, "Trend Cycle Length")
plot(FLD_out, color=color.new(col_d, FLDtransp), title='Trend FLD', offset = math.round(cyc_d/2) )
// Strategy Plots
price = source
signal = FLD_out[math.round(cyc_q/2)]
trade = FLD_out[math.round(cyc/2)]
trend = FLD_out[math.round(cyc_d/2)]
// Trend State
var state = 0
if signal > trade and trade > trend
state := 1 // (A)
state
if state == 1 and price < signal
state := 2 // (B)
state
if signal < trade and trade > trend
state := 3 // (C)
state
if state == 3 and price < signal
state := 4 // (D)
state
if signal < trade and trade < trend
state := 5 // (E)
state
if state == 5 and price < signal
state := 6 // (F)
state
if signal > trade and trade < trend
state := 7 // (G)
state
if state == 7 and price < signal
state := 8 // (H)
state
state := state
// Strategy Definitions
close_buy_out_1 = close_buy_in_1 == 'Price' ? price : close_buy_in_1 == 'Signal' ? signal : close_buy_in_1 == 'Trade' ? trade : close_buy_in_1 == 'Trend' ? trend : na
close_buy_out_2 = close_buy_in_2 == 'Price' ? price : close_buy_in_2 == 'Signal' ? signal : close_buy_in_2 == 'Trade' ? trade : close_buy_in_2 == 'Trend' ? trend : na
buy = ta.crossover(price, signal) and state == 1
close_buy = strategy.position_size>0 and ta.crossunder(close_buy_out_1, close_buy_out_2)
sell = ta.crossunder(price, signal) and state == 6
close_sell = strategy.position_size<0 and ta.crossover(close_buy_out_1, close_buy_out_2)
// FLD Interaction State Background
interaction_color = state == 1 ? color.green : // A
state == 2 ? color.aqua : // B
state == 3 ? color.blue : // C
state == 4 ? color.purple : // D
state == 5 ? color.white : // E
state == 6 ? color.red :// F
state == 7 ? color.orange : // G
state == 8 ? color.yellow : na // H
bgcolor(color.new(interaction_color, 90), title= "A-H Background")
bar_color = strategy.position_size>0 ? #00ff0a : strategy.position_size<0 ? #FF0000 : na
barcolor(bar_color)
if buy
strategy.entry("Buy", strategy.long)
if close_buy
strategy.close("Buy", qty_percent=100)
if sell
strategy.entry("Sell", strategy.short)
if close_sell
strategy.close("Sell", qty_percent=100)
// EoS made w/ ❤ by @BarefootJoey ✌💗📈