Zスコアに基づくトレンドフォロー戦略

1
Follow
1782
Followers
概要
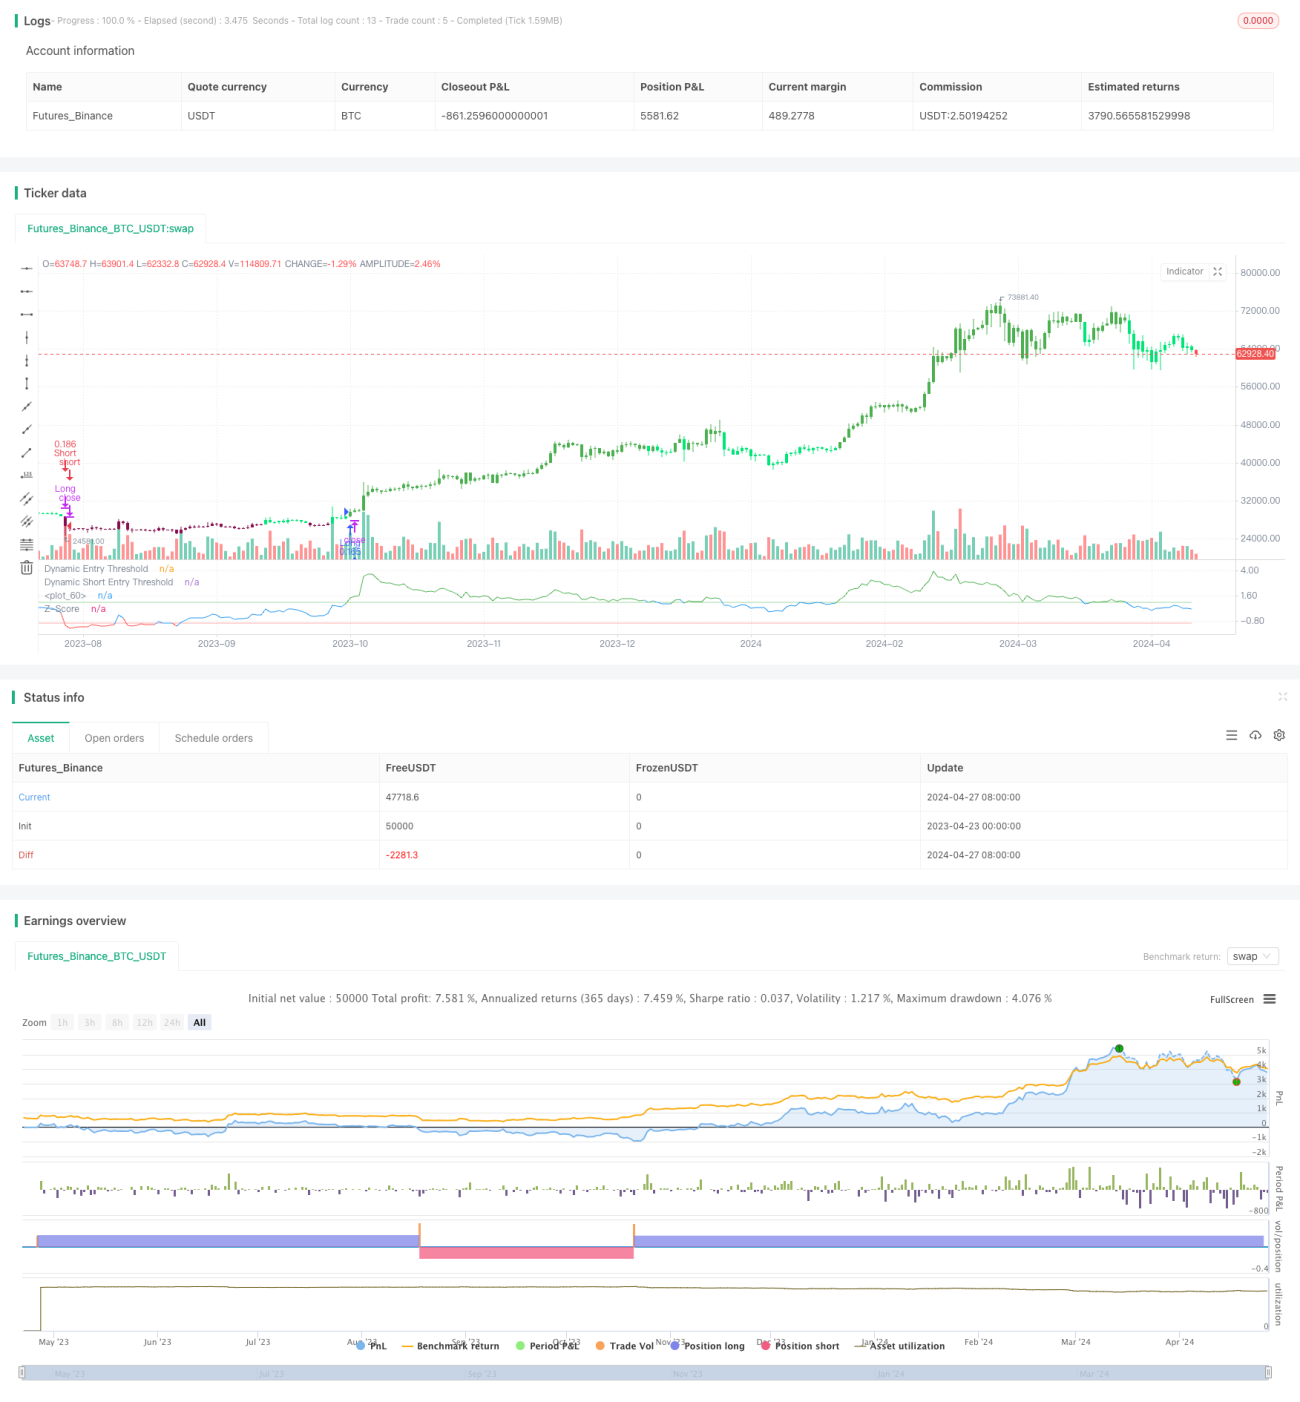
"Z値ベースのトレンドトラッキング戦略"は,Z値という統計指標を活用して,価格が移動平均から偏っている程度を測定し,標準差を統一尺度として使用して,トレンドの機会を捉えます.この戦略は,簡潔さと有効性のために知られており,特に価格運動が常時均等値に戻る市場には適しています.複数の指標に依存する複雑なシステムとは異なり, "Z値トレンド戦略"は,明瞭で統計的に顕著な価格変動に焦点を当てており,精密なデータ駆動型の方法が好まれるトレーダーに最適です.
戦略原則
この戦略の核心は,Z値の計算である.Z値は,現在の価格とユーザ定義の長さの価格指数移動平均 (EMA) の差を計算し,同じ長さの価格基準差を割り算することによって得られます:
z = (x - μ) / σ
その中で,xは現在の価格,μはEMA平均値,σは標準差である.
取引シグナルは,Z値が予期された<unk>値を越えた上で生成される:
- 多頭入場:Z値が正<unk>値を超えると
- 多頭出場:Z値が負の<unk>値を下に突破する.
- 空頭入場:Z値が負の<unk>値を下に突破する.
- 空頭出場: Z値が正<unk>値を超えたとき.
戦略的優位性
- 簡潔で効果的:この戦略は数少ないパラメータに依存し,理解し,実行しやすく,同時にトレンドの機会を捉えるのに非常に効果的です.
- 統計学的基礎:Z値は,成熟した統計学的ツールとして,この戦略に堅固な理論的基礎を提供している.
- 適応性:<unk>値,EMA,標準差の計算周期などのパラメータを調整することにより,この戦略は異なる取引スタイルと市場環境に柔軟に適応します.
- 明確なシグナル:Z値による<unk>値越えの取引シグナルが単純で明快で,迅速な意思決定と実行に役立ちます.
戦略リスク
- パラメータが敏感である:不適切なパラメータ設定 (<unk>値があまりにも高く,あるいは低すぎると) は,取引信号を誤って,機会を逃したり,損失を招く可能性があります.
- トレンド認識: 波動や市場整合で,この戦略は頻繁に偽信号に直面し,不良なパフォーマンスを発揮する.
- 遅延効果:トレンド追跡策として,その入場と出場シグナルには一定の遅延があり,最適なタイミングを逃す可能性があります.
上記のリスクは,継続的な市場分析,パラメータの最適化,および反省に基づいて慎重に実施することで,制御および緩和することができる.
戦略最適化の方向性
- 動的<unk>値:波動率に関連した動的<unk>値を導入し,異なる市場状況に効果的に適応し,信号品質を向上させる.
- 組合せ指標:RSI,MACDなどの他の技術指標を統合し,取引信号を二次確認し,信頼性を向上させる.
- ポジション管理:ATRなどのポジション制御メカニズムを組み込み,波動市場では適時減仓,トレンド市場では適時増仓,利益リスク比率を最適化します.
- 複数のタイムスケール:複数のタイムスケールにわたるZ値を計算し,さまざまなレベルのトレンドを捉え,戦略の次元を豊かにする.
要約する
"Z値ベースのトレンド追跡戦略"は,簡潔で,堅牢で,柔軟な特質で,トレンドの機会を捉えるためのユニークな視点を提供します.合理的なパラメータ設定,慎重なリスク管理,継続的な最適化により,この戦略は,変化する市場の中で安定して前進する量化トレーダーの強力な助手になる可能性があります.
Source
Pine
/*backtest
start: 2023-04-23 00:00:00
end: 2024-04-28 00:00:00
period: 1d
basePeriod: 1h
exchanges: [{"eid":"Futures_Binance","currency":"BTC_USDT"}]
*/

// This Pine Script™ code is subject to the terms of the Mozilla Public License 2.0 at https://mozilla.org/MPL/2.0/
// © PresentTrading

// This strategy employs a statistical approach by using a Z-score, which measures the deviation of the price from its moving average normalized by the standard deviation.Strategy parameters
Related strategies
Comment
All comments (0)
No data
- 1