フィボナッチ黄金比リトレースメント購入戦略
作成日:
2024-04-29 17:08:07
最終変更日:
2024-04-29 17:08:07
コピー:
6
クリック数:
750
1
フォロー
1750
フォロワー
概要
フィボナッチ金分割逆戻り買入戦略は,フィボナッチ逆戻りレベルとトレンドトラッキングストップをベースにした取引戦略である.この戦略は,フィボナッチ逆戻りレベルを潜在的サポートとレジスタンスとして使用し,トレンドトラッキングストップと組み合わせて,買入と売却のタイミングを決定する.価格が上昇傾向で特定のフィボナッチレベルに逆戻りし,トレンドトラッキングストップを超えると,戦略は買入シグナルを発信する.価格がトレンドトラッキングストップまたは特定のフィボナッチレベルを破ると,戦略は販売シグナルを発信する.
戦略原則
- フィボナッチ・リトロールレベルを計算する.指定した価格区間の最高価格と最低価格に基づいて,0%,23.6%,38.2%,50%,61.8%,78.6%のフィボナッチ・リトロールレベルを計算する.
- 変動高点と低点を識別する:指定された取引数の周期内,価格の変動高点と低点を識別する.
- トレンドフォローストロップを計算する.現在の閉盘価格が前回の高値より高く,前回の低値より低く,その傾向フォローストロップを計算する.
- 買入と出札の条件を定義する. 閉盘価格がトレンドフォローストップより高く,あるフィボナッチ逆戻りレベルより高いとき,買入シグナルを生成する. 閉盘価格がトレンドフォローストップより低く,あるフィボナッチ逆戻りレベルより低いとき,売出シグナルを生成する.
- 取引実行: 購入条件が満たされたときに,戦略は多頭ポジションに入ります. 販売条件が満たされたときに,戦略は平仓します.
戦略的優位性
- テクニカル分析とトレンド追跡を組み合わせる:この戦略は,フィボナッチ・リターンレベルを潜在的サポートとレジスタンスとして使用し,トレンド追跡のストップと組み合わせることで,トレンドの機会を効果的に捉え,リスクを制御できます.
- 異なる市場状況に適応する:フィボナッチ・リトラクションレベルは,異なる市場条件に一定の適用性があり,上昇傾向と下降傾向の取引に参考を提供することができます.
- 明確な入場・出場条件: 戦略は明確な買出条件に基づいており,トレーダーが客観的な決定を下し,主観的な感情の影響を避けるのに役立ちます.
戦略リスク
- 市場波動のリスク: 市場が激しく波動すると,価格がフィボナッチ逆戻りレベルとトレンド追跡ストップを素早く破り,戦略の誤りやストップを過剰に発生させる可能性があります.
- パラメータ設定のリスク:戦略のパフォーマンスはフィボナッチ・リトラクションレベルとトレンド・トラッキング・ストップのパラメータ設定に依存し,不適切なパラメータは戦略の不良パフォーマンスを引き起こす可能性があります.
- トレンド識別リスク: 策略は,価格運動がトレンドに従うと仮定するが,実際の市場では,価格が揺れまたは反転し,トレンド識別に誤判を招く可能性がある.
戦略最適化の方向性
- 他の技術指標と組み合わせる: フィボナッチ・リトラクションレベルを他の技術指標 (移動平均,相対的強弱指数など) と組み合わせて使用することを検討し,戦略の信頼性を高める.
- 動的調整パラメータ:市場の状況の変化に応じて,動的にフィボナッチ・リトラクション・レベルとトレンド・トラッキング・ストップのパラメータを調整し,異なる市場環境に対応する.
- リスク管理策の導入:潜在的リスクの開口を制御するために,戦略にポジション管理,ストップダメージ管理などのリスク管理策の導入.
要約する
フィボナッチ・ゴールド・スプリング・レトロ・バイ・ストラテジーは,フィボナッチ・レトロ・レベルとトレンド・トラッキング・ストップ・ローズを組み合わせた取引戦略である.この戦略は,フィボナッチ・レトロ・レベルを潜在的サポートとレジスタンスとして利用し,トレンド・トラッキング・ストップ・ローズと組み合わせて,買入と売却のタイミングを決定する.この戦略の優点は,技術分析とトレンド・トラッキングを組み合わせて,異なる市場状況に適応し,明確な入場と出場条件を提供することにある.しかし,戦略は,市場変動のリスク,パラメータ設定のリスク,トレンド識別のリスクにも直面している.戦略のパフォーマンスを最適化するために,他の技術指標,動態調整パラメータ,およびリスク管理の導入を考慮することができる.
ストラテジーソースコード
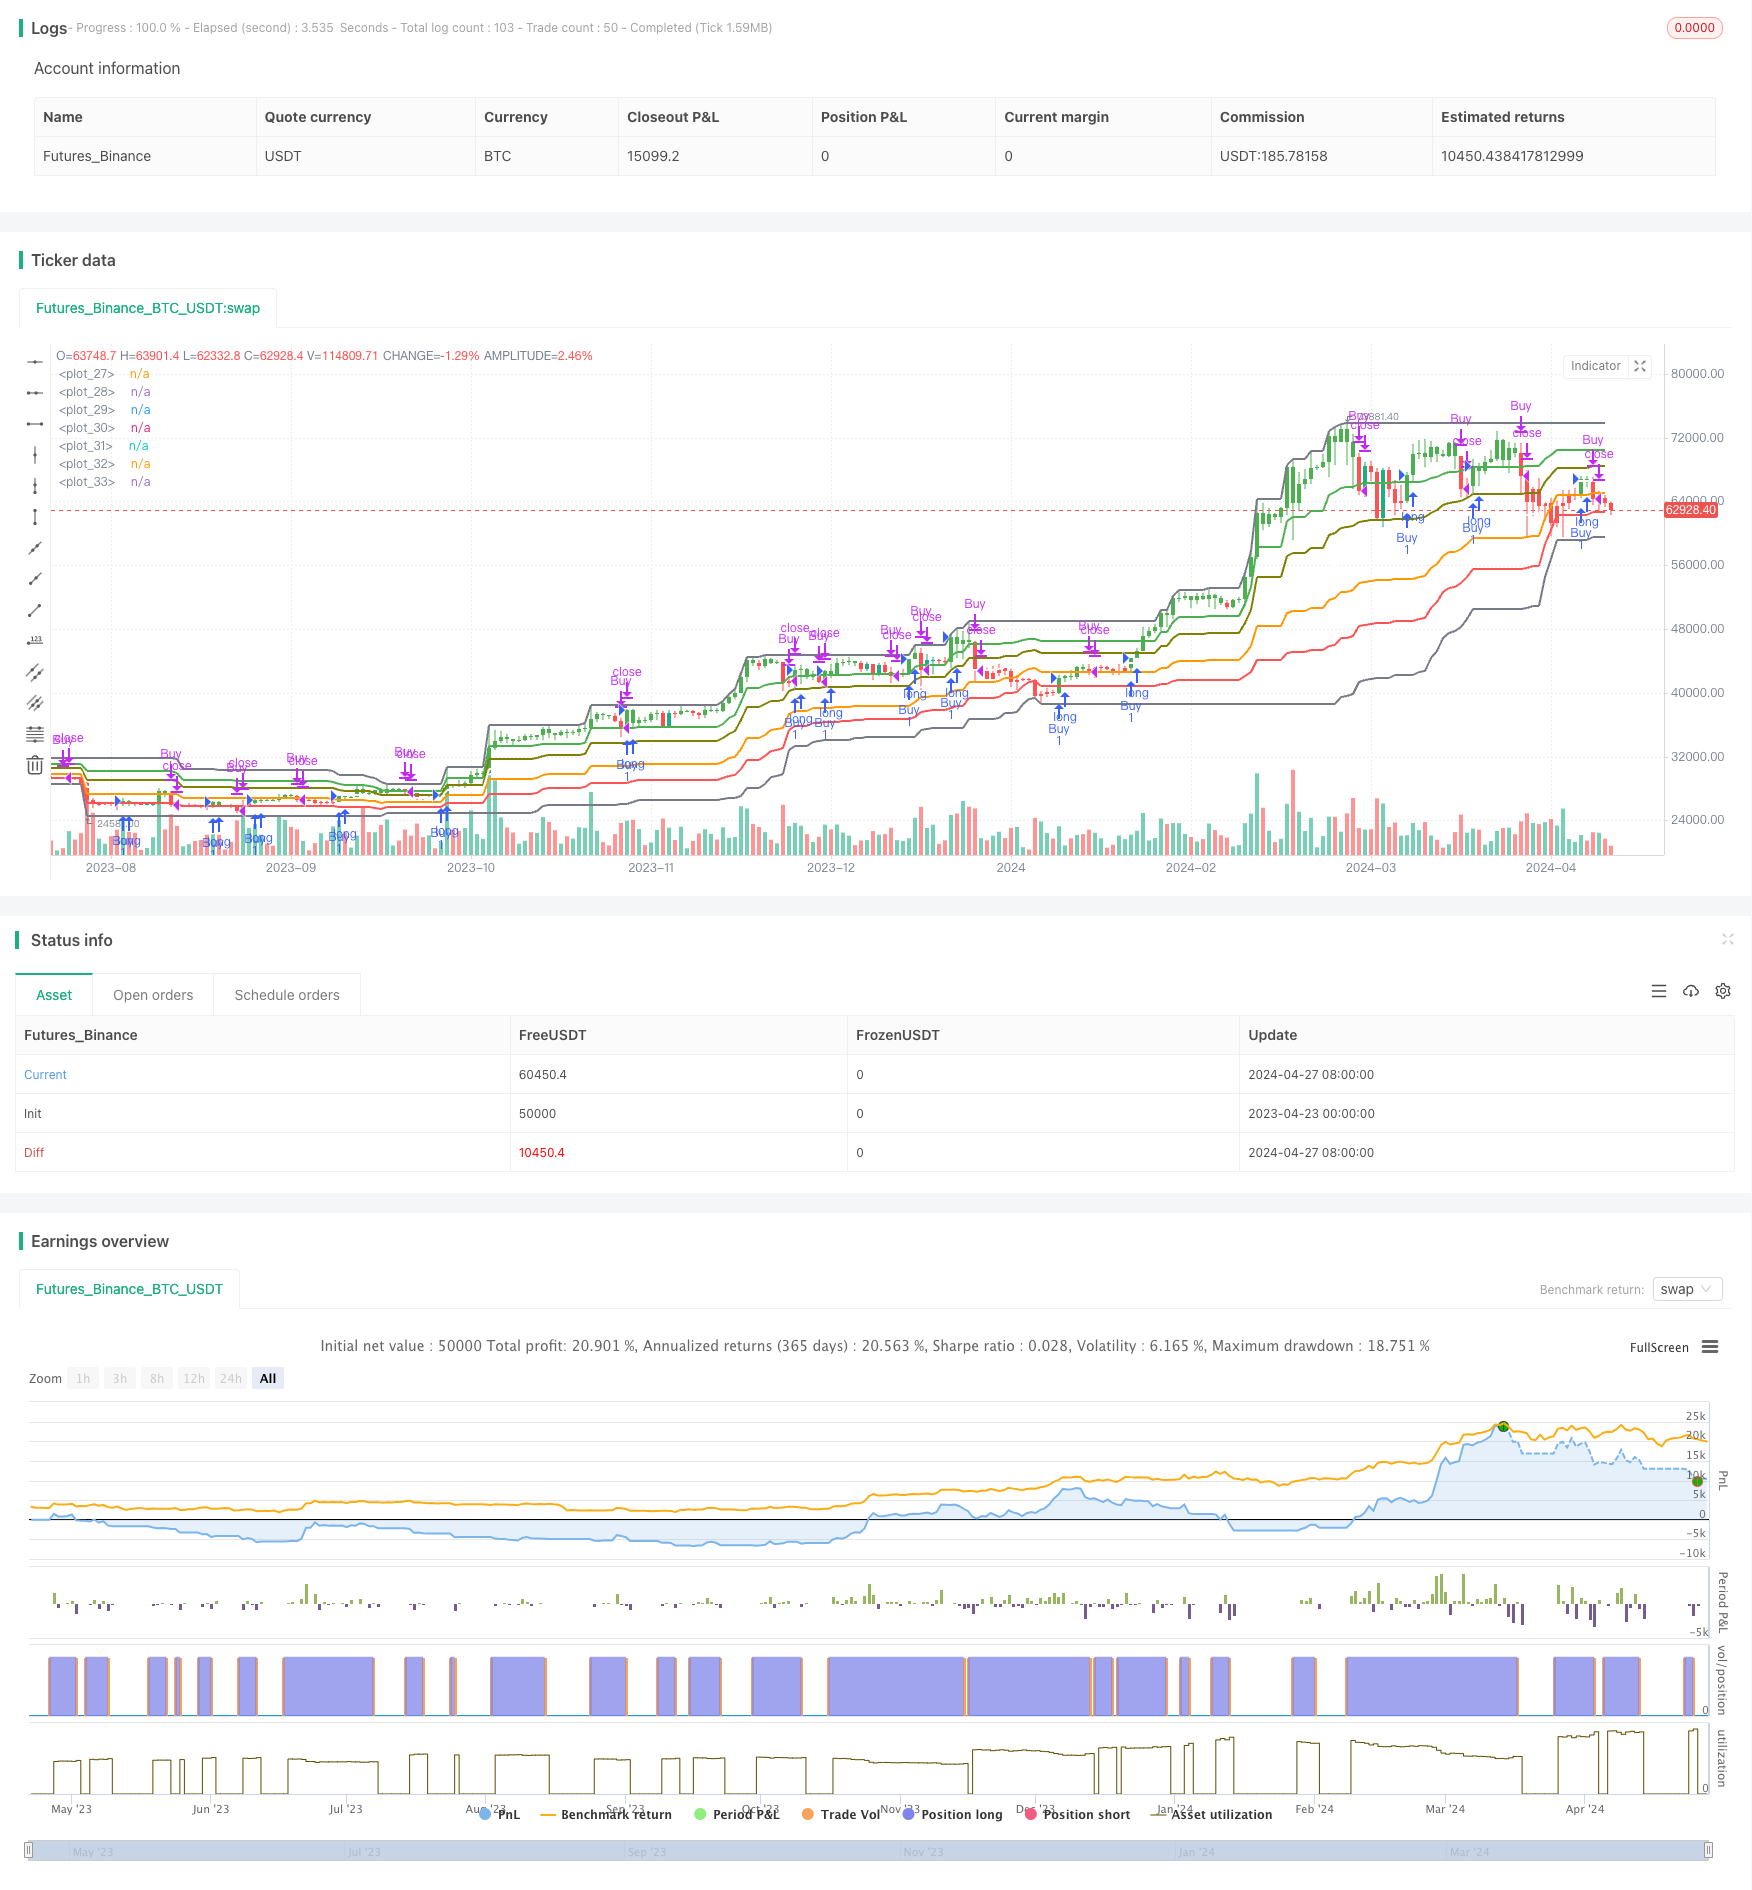
/*backtest
start: 2023-04-23 00:00:00
end: 2024-04-28 00:00:00
period: 1d
basePeriod: 1h
exchanges: [{"eid":"Futures_Binance","currency":"BTC_USDT"}]
*/

//@version=5
strategy(title='Fibonacci BFSP', overlay=true)

// Define Fibonacci retracement levels
fib0 = input(0, title="Fibonacci 0% Level")
fib1 = input(1, title="Fibonacci 1% Level")
fib23 = input(0.236, title="Fibonacci 23.6% Level")
fib38 = input(0.382, title="Fibonacci 38.2% Level")
fib50 = input(0.5, title="Fibonacci 50% Level")
fib61 = input(0.618, title="Fibonacci 61.8% Level")
fib78 = input(0.786, title="Fibonacci 78.6% Level")
Price = input(50, title="Price")

// Calculate Fibonacci levels
priceHigh = ta.highest(high, Price)
priceLow = ta.lowest(low, Price)
priceRange = priceHigh - priceLow
fibRetracement0 = priceHigh - fib0 * priceRange
fibRetracement1 = priceHigh - fib1 * priceRange
fibRetracement23 = priceHigh - fib23 * priceRange
fibRetracement38 = priceHigh - fib38 * priceRange
fibRetracement50 = priceHigh - fib50 * priceRange
fibRetracement61 = priceHigh - fib61 * priceRange
fibRetracement78 = priceHigh - fib78 * priceRange

// Plot Fibonacci retracement levels
plot(fibRetracement0, color=color.gray, linewidth=2)
plot(fibRetracement1, color=color.gray, linewidth=2)
plot(fibRetracement23, color=color.green, linewidth=2)
plot(fibRetracement38, color=color.olive, linewidth=2)
plot(fibRetracement50, color=color.white, linewidth=2)
plot(fibRetracement61, color=color.orange, linewidth=2)
plot(fibRetracement78, color=color.red, linewidth=2)

// Inputs
no = input(1, title="Swing")

// Calculate swing highs and lows
res = ta.highest(high, no)
sup = ta.lowest(low, no)

// Calculate trailing stop loss
avd = close > res[1] ? 1 : close < sup[1] ? -1 : 0
avn = ta.valuewhen(avd != 0, avd, 0)
tsl = avn == 1 ? sup : res

// Define buy and sell conditions
buyCondition = (close > tsl) and (close > fibRetracement23 or close > fibRetracement38 or close > fibRetracement50 or close > fibRetracement61 or close > fibRetracement78)
sellCondition = (close < tsl) and (close < fibRetracement23 or close < fibRetracement38 or close < fibRetracement50 or close < fibRetracement61 or close < fibRetracement78)

// Entry strategy
if (buyCondition)
    strategy.entry("Buy", strategy.long)

// Exit strategy
if (sellCondition)
    strategy.close("Buy")

// Color bars based on buy and sell conditions
barColor = buyCondition ? color.green : sellCondition ? color.red : na
barcolor(barColor)