移動平均クロスオーバー戦略

1
Follow
1782
Followers
概要
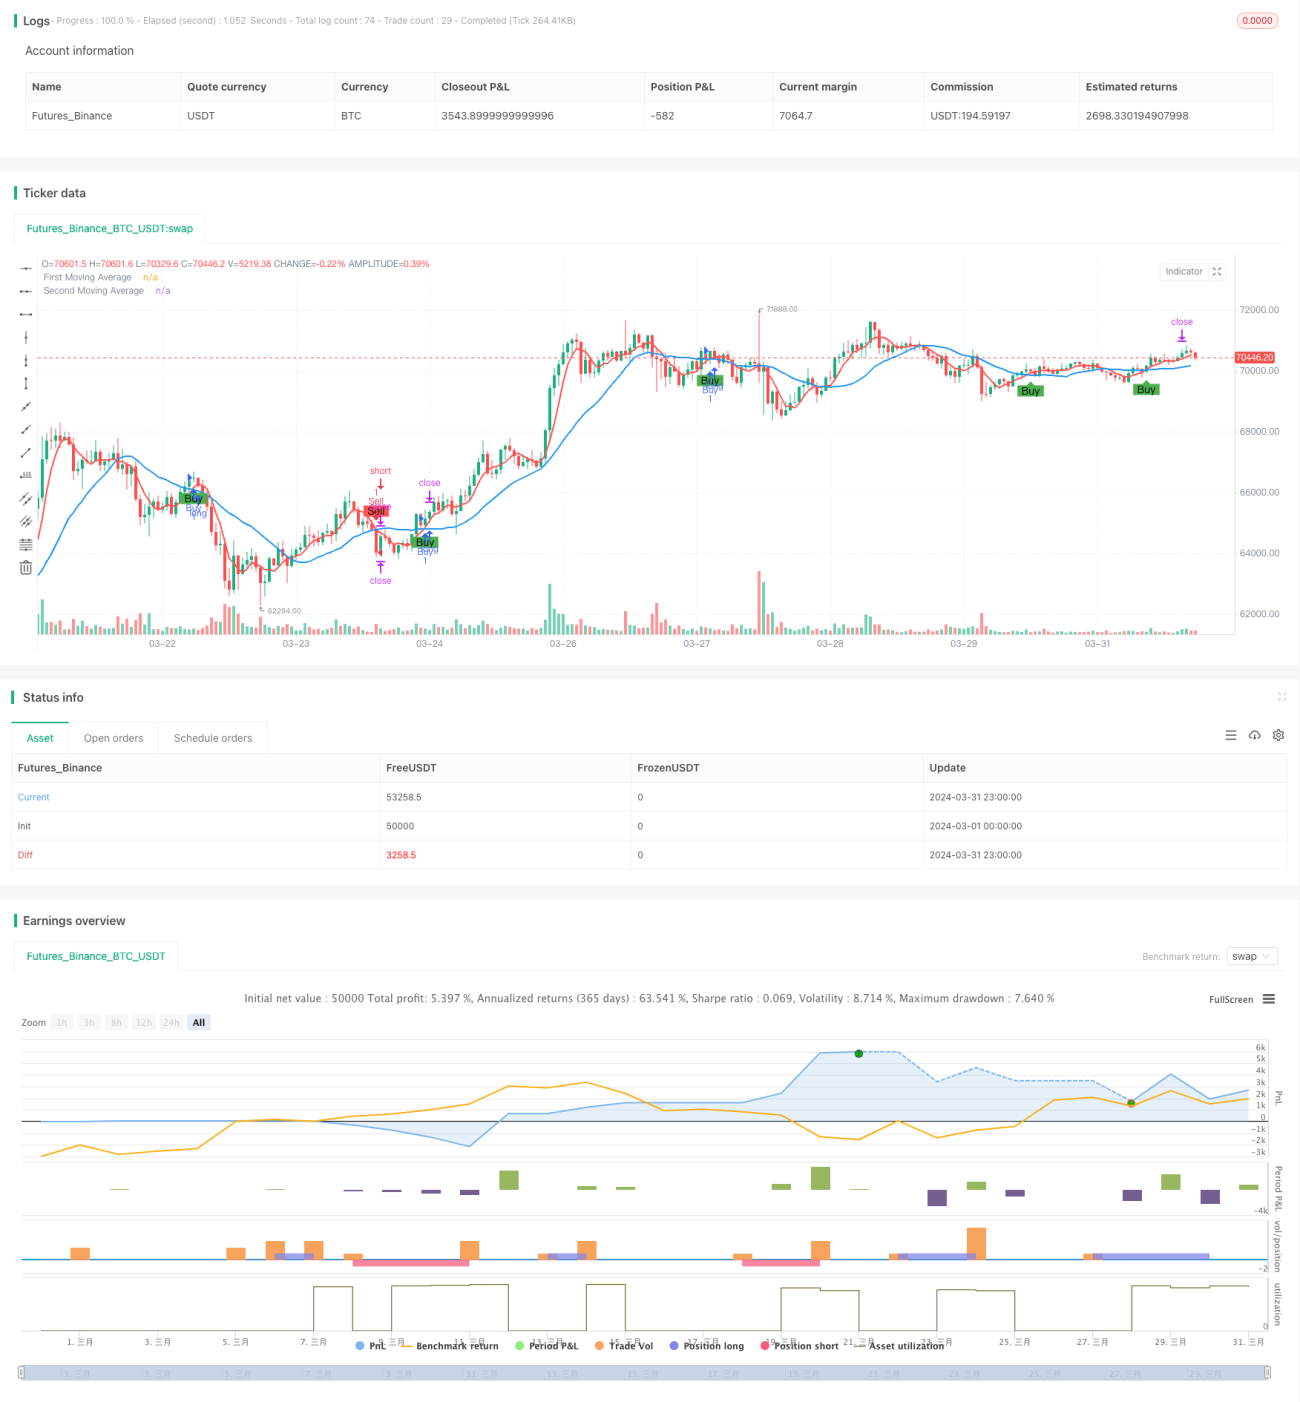
この戦略は,2つの移動平均線 (((MA) を使って取引信号を生成する.より短い周期のMAがより長い周期のMAを下から上へと渡るとき,買入信号を生成する.より短い周期のMAがより長い周期のMAを上から下へと渡るとき,売出信号を生成する.この戦略は,取引時間帯 (((UTC 8時~20時) とストップポイント (((150ポイント) を同時に設定する.
戦略原則
- 2つの異なる周期の移動平均を計算する (デフォルトは5周期と20周期).
- 短周期MAが長周期MAを上下しているかどうかを判断し,これを買い/売り信号として使う.
- 取引の時間帯は,UTC8時~20時と設定し,その時間帯内でのみ取引を行う.
- 最新の4つのK線がMA上下で結束しているかどうかを判断してトレンドを確認します.
- 買入/売却条件を満たした場合は,ポジションを開き,150ポイントのストップを設定します.
戦略的優位性
- 2つの異なる周期のMAを使用することで,トレンドを効果的に捉えることができ,トレンド市場に適用されます.
- 取引の時間帯を設定することで,流動性の低い時間帯で取引を避け,リスクを軽減できます.
- 最近の4つのK線がMA上/下に閉じているかどうかを判断することで,トレンドを確認し,信号の信頼性を向上させることができる.
- 固定ストップポイントを設定し,利益を効果的にロックし,リスクを制御します.
戦略リスク
- 波動的な市場では,この戦略は誤った信号を頻繁に発生させ,損失を招く可能性があります.
- 固定ストップポイントは,戦略の利益の余地を制限する可能性があります.
- この戦略は,ストップを設定していないので,市場が急激に逆転すると,大きなリスクに直面する可能性があります.
戦略最適化の方向性
- RSI,MACDなどの技術指標を導入することで,信号の信頼性を向上させることが考えられます.
- 動的ストップストップまたはATRベースのストップストップなどのストップストップの設定を最適化できます.
- 取引信号の二次確認は,注文流などの情報と市場の微細構造を組み合わせることができます.
- 異なる市場状態 ((トレンド/振動) に応じて異なるパラメータ設定を適用して,戦略の適応性を向上させることができる.
要約する
この戦略は,2つの異なる周期の移動平均の交差を基に取引信号を生成し,トレンド市場に適用されます.取引時間帯と固定ストップポイントを設定することで,リスクを一定程度に制御できます.しかし,この戦略は,揺れ動いている市場ではうまく機能しない可能性があり,固定ストップポイントは,戦略の利益のスペースを制限します.将来,より多くの技術指標を導入し,ストップポイントの設定を最適化し,市場微細構造情報と組み合わせて,異なる状態の市場に対して異なるパラメータの設定をとり,この戦略を最適化することを考慮することができます.
Source
Pine
Strategy parameters
Related strategies
Comment
All comments (0)
No data
- 1