EMAクロスオーバー戦略とRSIダイバージェンス、30分間のトレンド識別と価格枯渇

1
Follow
1789
Followers
概要
この戦略は,EMA交差,RSI偏差,30分トレンド識別,価格の枯渇などの技術指標を組み合わせて,市場トレンドと価格の曲折点を捉えることを目的としています.戦略は,EMA13とEMA26の交差を通してトレンドの方向を決定し,RSI偏差を使用して潜在的なトレンドの逆転を識別し,30分時間枠内のトレンド状態と価格の枯渇を考慮しながら,エントリーポイントを最適化します.
戦略原則
- EMA交差: EMA13の上部でEMA26を突破すると買入シグナルが生み出され,下部に突破すると売出シグナルが生み出されます.
- RSI偏差:価格創出が低く,RSIが創出が低いとき,看板偏差が生じます.価格創出が高く,RSIが創出が高く,看板偏差が生じます.
- 30分トレンド識別: 30分EMA5とEMA10との関わりを比較して,現在の30分タイムフレーム内のトレンド状態を判断する.
- 価格の尽きる: RSI指標を用いて価格の超買いと超売り状態を識別する.
- 取引シグナル:上記の要素を総合し,EMA交差,RSI偏差,30分上昇傾向で価格が超売りしたときに買取シグナルを生じます.EMA交差,RSI偏差,30分下降傾向で価格が超売りしたときに売り出せシグナルを生じます.
戦略的優位性
- 多次元分析:トレンド,動力,価格などの多次元を組み合わせ,信号の正確性を向上させる.
- トレンド確認: 30分間のタイムフレーム内のトレンドを判断し,波動的な市場で頻繁に取引することを避ける.
- ターニングポイントキャプチャ: RSIの偏差値と価格の枯渇を利用して,潜在的なトレンドの転換点をキャプチャする.
- リスク管理:トレンドが確認され,ターニングポイントが表示された後に取引を継続し,リスクを軽減します.
戦略リスク
- パラメータ最適化:戦略で使用されるEMA周期,RSI周期などのパラメータは,異なる市場と資産に応じて最適化する必要がある.
- トレンド転換: トレンド転換の初期に,EMA交差とRSIが信号から離れる場合の遅延または誤導が発生する可能性があります.
- 誤信号:RSIが誤信号を誘発し,誤取引を誘発する場合がある.
- 突発事件: 市場における突発事件や不合理な波動に対応できない可能性のある戦略.
戦略最適化の方向性
- 動的パラメータ最適化:市場の状態と波動率に応じて,EMAとRSI周期などのパラメータを動的に調整する.
- トレンド強度フィルター:ADXなどのトレンド強度指標を導入し,弱気トレンドまたは振動市場のシグナルをフィルターする.
- 複数のタイムフレームの確認:複数のタイムフレームのトレンドと信号を組み合わせて,信号の信頼性を向上させる.
- ストップ・アンド・ストップ:適切なストップ・アンド・ストップ戦略を導入し,リスクをさらに管理し,利益を最適化する.
要約する
この戦略は,EMA交差,RSI偏差,30分トレンド識別および価格の尽きることなどの技術指標を組み合わせて,市場を複数の次元で分析し,トレンドと潜在的なターニングポイントを捕捉します.戦略の優点は,多次元分析,トレンド確認,ターニングポイントキャプチャおよびリスク制御にありますが,パラメータ最適化,トレンド転換,偽信号と突発事件などのリスクもあります.
Source
Pine
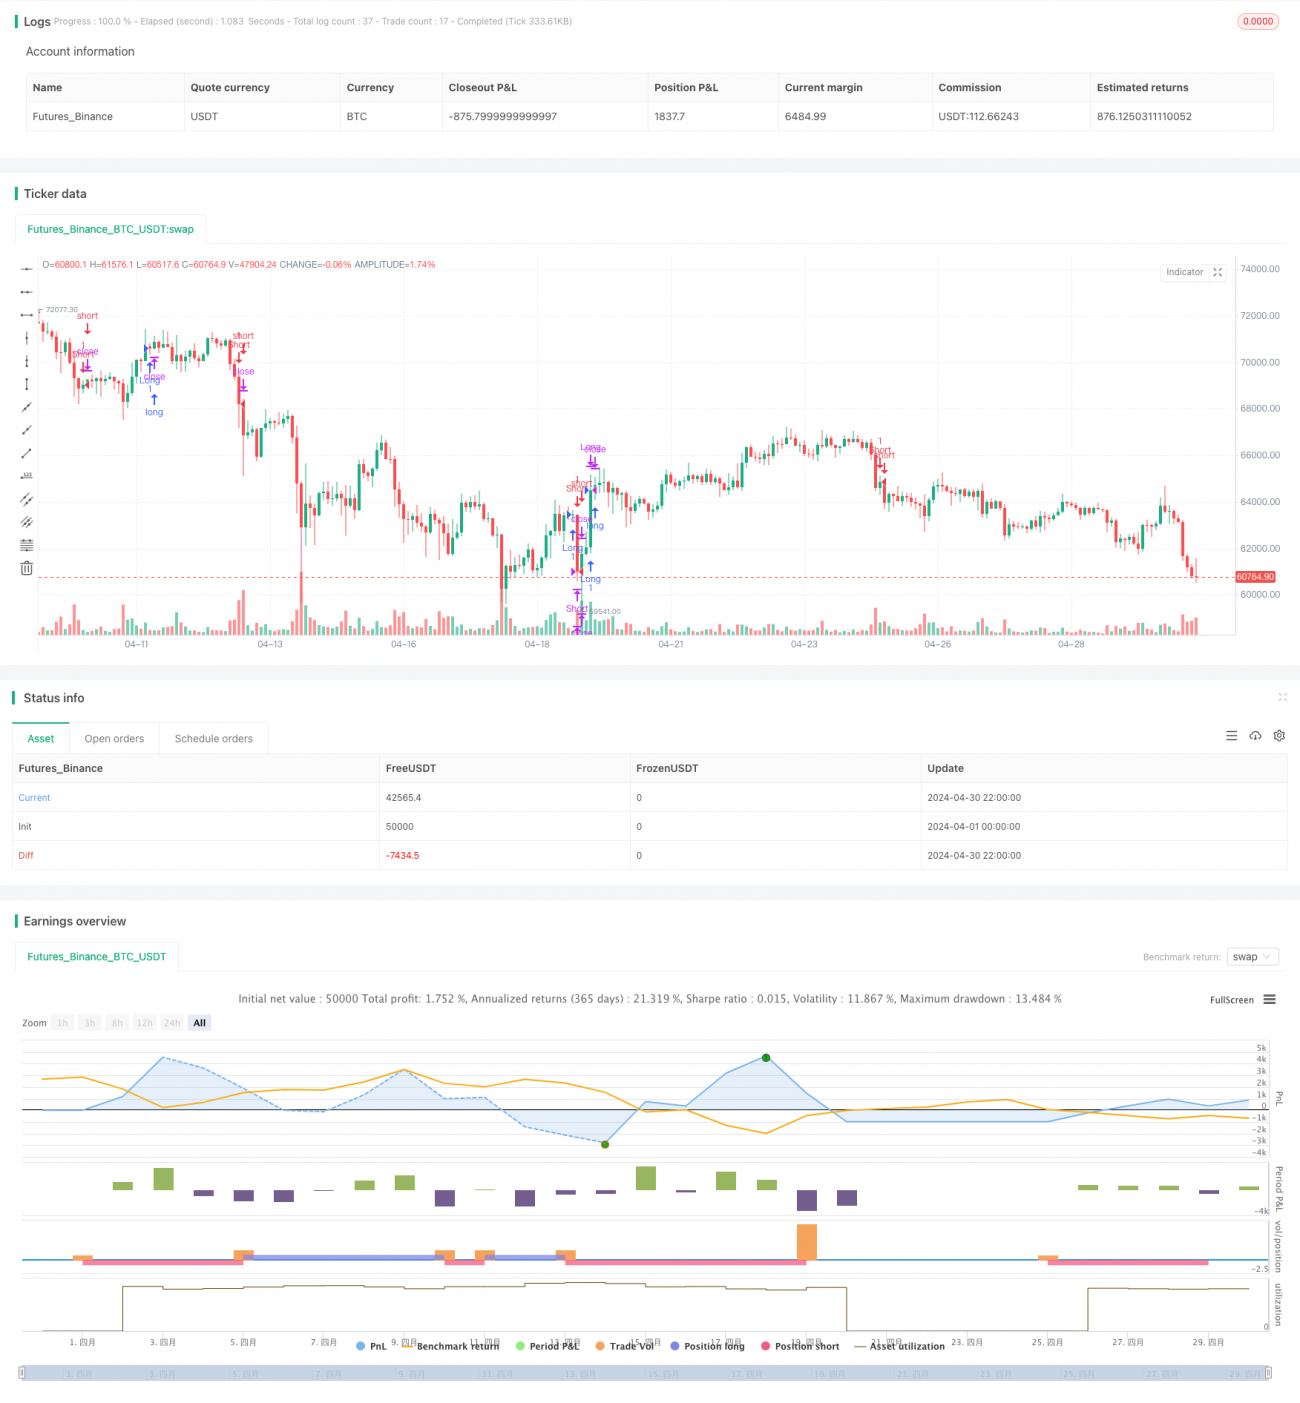
/*backtest
start: 2024-04-01 00:00:00
end: 2024-04-30 23:59:59
period: 2h
basePeriod: 15m
exchanges: [{"eid":"Futures_Binance","currency":"BTC_USDT"}]
*/

//@version=5
strategy("EMA Cross Strategy with RSI Divergence, 30-Minute Trend Identification, and Price Exhaustion", overlay=true)

// Definição das médias móveis exponenciais para tendência de curto prazo (30 minutos)Related strategies
Comment
All comments (0)
No data
- 1