200移動平均、VWAP、MFIトレンドフォロー戦略
作成日:
2024-05-14 16:26:49
最終変更日:
2024-05-14 16:26:49
コピー:
6
クリック数:
981
1
フォロー
1750
フォロワー
概要
この戦略は,200日指数移動平均 ((200 EMA),成交量重量平均価格 ((VWAP) とキャピタルフロー指数 ((MFI) を組み合わせて買入シグナルを生成する.主な考え方は,この3つの指標の組み合わせを使用してトレンドの方向と強さを判断し,価格が200 EMAを突破し,VWAPとMFIの指標が確認された場合に取引シグナルを生成することである.同時に,トレンドフィルターとして上位時間周期の200 EMAを導入し,現在の時間周期と上位時間周期のトレンドが一致するときにのみ取引することである.さらに,価格の動きの連続性を判断することによって,信号の信頼性を高める.
戦略原則
- 200日EMAを計算し,入力されたバッファローズのパーセントに基づいてバッファローズの上下を計算する.
- VWAP指数を計算する
- MFI指標の14サイクルを計算し,購入と販売の値を設定する.
- 傾向フィルターとして,上位時間周期の200 EMAを取得します.
- 価格の動きの連続性を判断し,連続した上昇または下降の条件を満たしているかどうかをチェックする.
- 上述の条件を総合して,買入シグナルを生成する条件は,閉盘価格が200 EMAを突破し,VWAPより高く,MFIが買入値より大きく,閉盘価格が上位時間周期の200 EMAより高く,価格動きが継続的に上昇していることです.
- 売却シグナルの条件は,収束価格が200 EMA下落してVWAPを下回り,MFIは値を売却するより小さい,収束価格が200 EMA下を上昇した時間周期で,価格の動きは連続して下落している.
- 買取または販売条件を満たしたときに,戦略は,それに対応する多頭または空頭取引を行う.
戦略的優位性
- 複数の指標を組み合わせて総合判断を行い,偽信号を効果的にフィルターし,信号の信頼性を高めます.
- 高級時間周期のトレンドフィルタを導入し,取引決定を大トレンドと一致させ,逆行取引のリスクを軽減します.
- 価格動向の連続性を判断することで,トレンドの強さをさらに確認し,入場時刻の正確性を向上させる.
- バッパーゾーンという概念を用いて,価格が一定範囲で波動することを許し,頻繁に取引を避ける.
- パラメータは調整可能で,柔軟性があり,異なる市場と取引スタイルに合わせて最適化できます.
戦略リスク
- 市場が揺れ動いている時やトレンドが転換する時に,指数は誤った信号を出し,損失を招く可能性があります.
- パラメータを正しく設定しない場合,戦略の不良なパフォーマンスを引き起こす可能性があります.例えば,バッファローンの大きすぎると取引機会が逃れ,小さすぎると頻繁に取引が起こります.
- 策略は,過去のデータによる計算と判断に依存し,突発的な出来事や黒天事件に対して,対応が遅れる可能性がある.
- トレンドが極端に続く場合や,急激に変動する場合は,特定の市場状況下で,戦略は失敗する可能性があります.
戦略最適化の方向性
- パラメータの最適化には,EMA周期,MFI周期と値,バッファローズのサイズなどのパラメータの最適な組み合わせを,歴史的データへのリサーチで探すことができます.
- 信号の信頼性と安定性をさらに高めるために,他の補助指標または市場情緒指標,ブリン帯,RSIなどの導入を検討することができます.
- 取引管理では,単一取引のリスクを制御するために,移動停止またはATRベースの動的な停止などのストップ・ストップ・メカニズムを導入することができます.
- リスクベースのポジションサイジングやケリー公式など,異なるポジション管理戦略を探索して,戦略のリスク/利益の比率を最適化することができる.
- 機械学習や自己適応アルゴリズムを導入し,市場の変化に対応するために戦略パラメータを動的に調整することを検討する.
要約する
この戦略は,200日EMA,VWAP,MFIの指標を組み合わせて,上級時間周期のトレンドと価格動向の連続性を考慮しながら,比較的安定したトレンド追跡取引システムを構築している.戦略は,複数の条件の総合的な判断によって偽信号をフィルターし,入場タイミングの正確性を向上させる.同時に,戦略のパラメータの柔軟性は,異なる市場と取引スタイルに応じて最適化することを可能にします.しかし,戦略には,不安定な市場やトレンドの転換点で損失が生じることや,パラメータの設定が不適切で不良なパフォーマンスを引き起こす可能性など,一定のリスクがあります.
ストラテジーソースコード
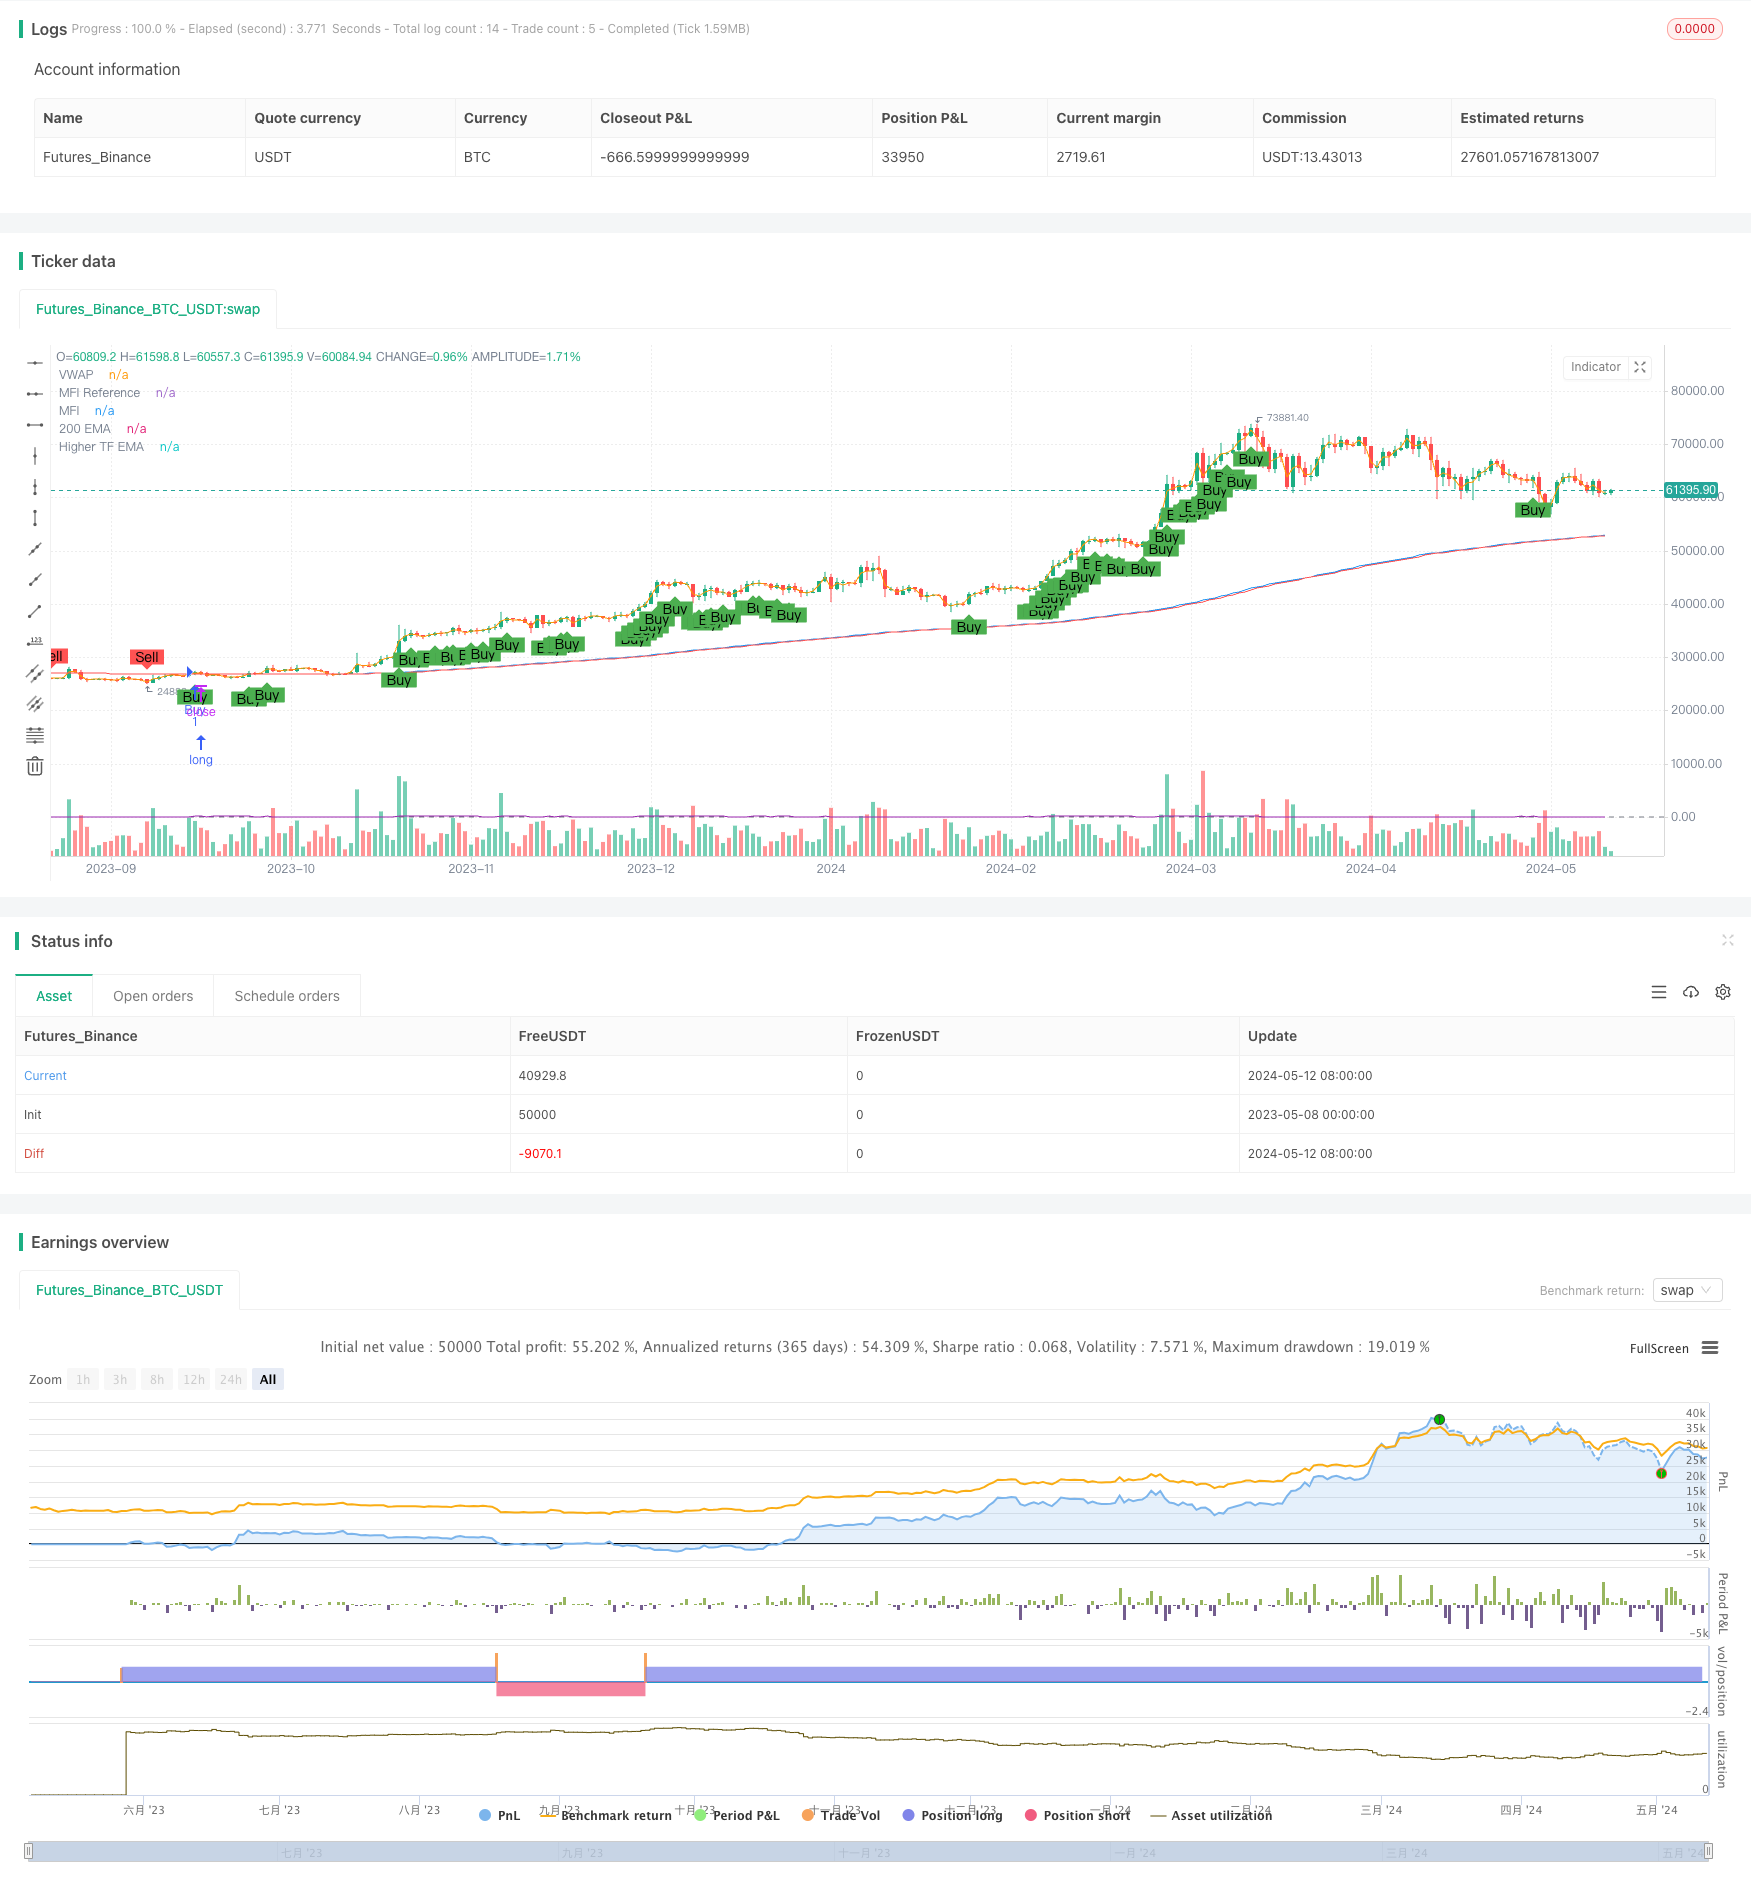
/*backtest
start: 2023-05-08 00:00:00
end: 2024-05-13 00:00:00
period: 1d
basePeriod: 1h
exchanges: [{"eid":"Futures_Binance","currency":"BTC_USDT"}]
*/

//@version=5
strategy("200 EMA, VWAP, MFI Strategy - Visible Signals", overlay=true, pyramiding=0)

// Inputs for dynamic adjustments
buffer = input.float(0.2, title="EMA Buffer Percentage", step=0.1) / 100
higherTimeframe = input.timeframe("15", title="Higher Timeframe")
mfiBuyThreshold = input(60, title="MFI Buy Threshold")
mfiSellThreshold = input(40, title="MFI Sell Threshold")
consecutiveCloses = input.int(1, title="Consecutive Closes for Confirmation")

// Calculate the 200-period EMA
ema200 = ta.ema(close, 200)
emaBufferedHigh = ema200 * (1 + buffer)
emaBufferedLow = ema200 * (1 - buffer)
emaHigher = request.security(syminfo.tickerid, higherTimeframe, ta.ema(close, 200))

// VWAP calculation
vwap = ta.vwap(hlc3)

// Money Flow Index calculation
mfiLength = 14
mfi = ta.mfi(close, mfiLength)

// Plotting the indicators
plot(ema200, title="200 EMA", color=color.blue)
plot(vwap, title="VWAP", color=color.orange)
plot(mfi, title="MFI", color=color.purple)
hline(50, "MFI Reference", color=color.gray, linestyle=hline.style_dashed)
plot(emaHigher, title="Higher TF EMA", color=color.red)

// Price action confirmation
isUpTrend = ta.rising(close, consecutiveCloses)
isDownTrend = ta.falling(close, consecutiveCloses)

// Define entry conditions
longCondition = close > emaBufferedHigh and close > vwap and mfi > mfiBuyThreshold and close > emaHigher and isUpTrend
shortCondition = close < emaBufferedLow and close < vwap and mfi < mfiSellThreshold and close < emaHigher and isDownTrend

// Trading execution
if (longCondition)
    strategy.entry("Buy", strategy.long)

if (shortCondition)
    strategy.entry("Sell", strategy.short)

// Plot shapes for signals
plotshape(series=longCondition, location=location.belowbar, color=color.green, style=shape.labelup, size=size.small, title="Buy Signal", text="Buy")
plotshape(series=shortCondition, location=location.abovebar, color=color.red, style=shape.labeldown, size=size.small, title="Sell Signal", text="Sell")