1
フォロー
1750
フォロワー
概要
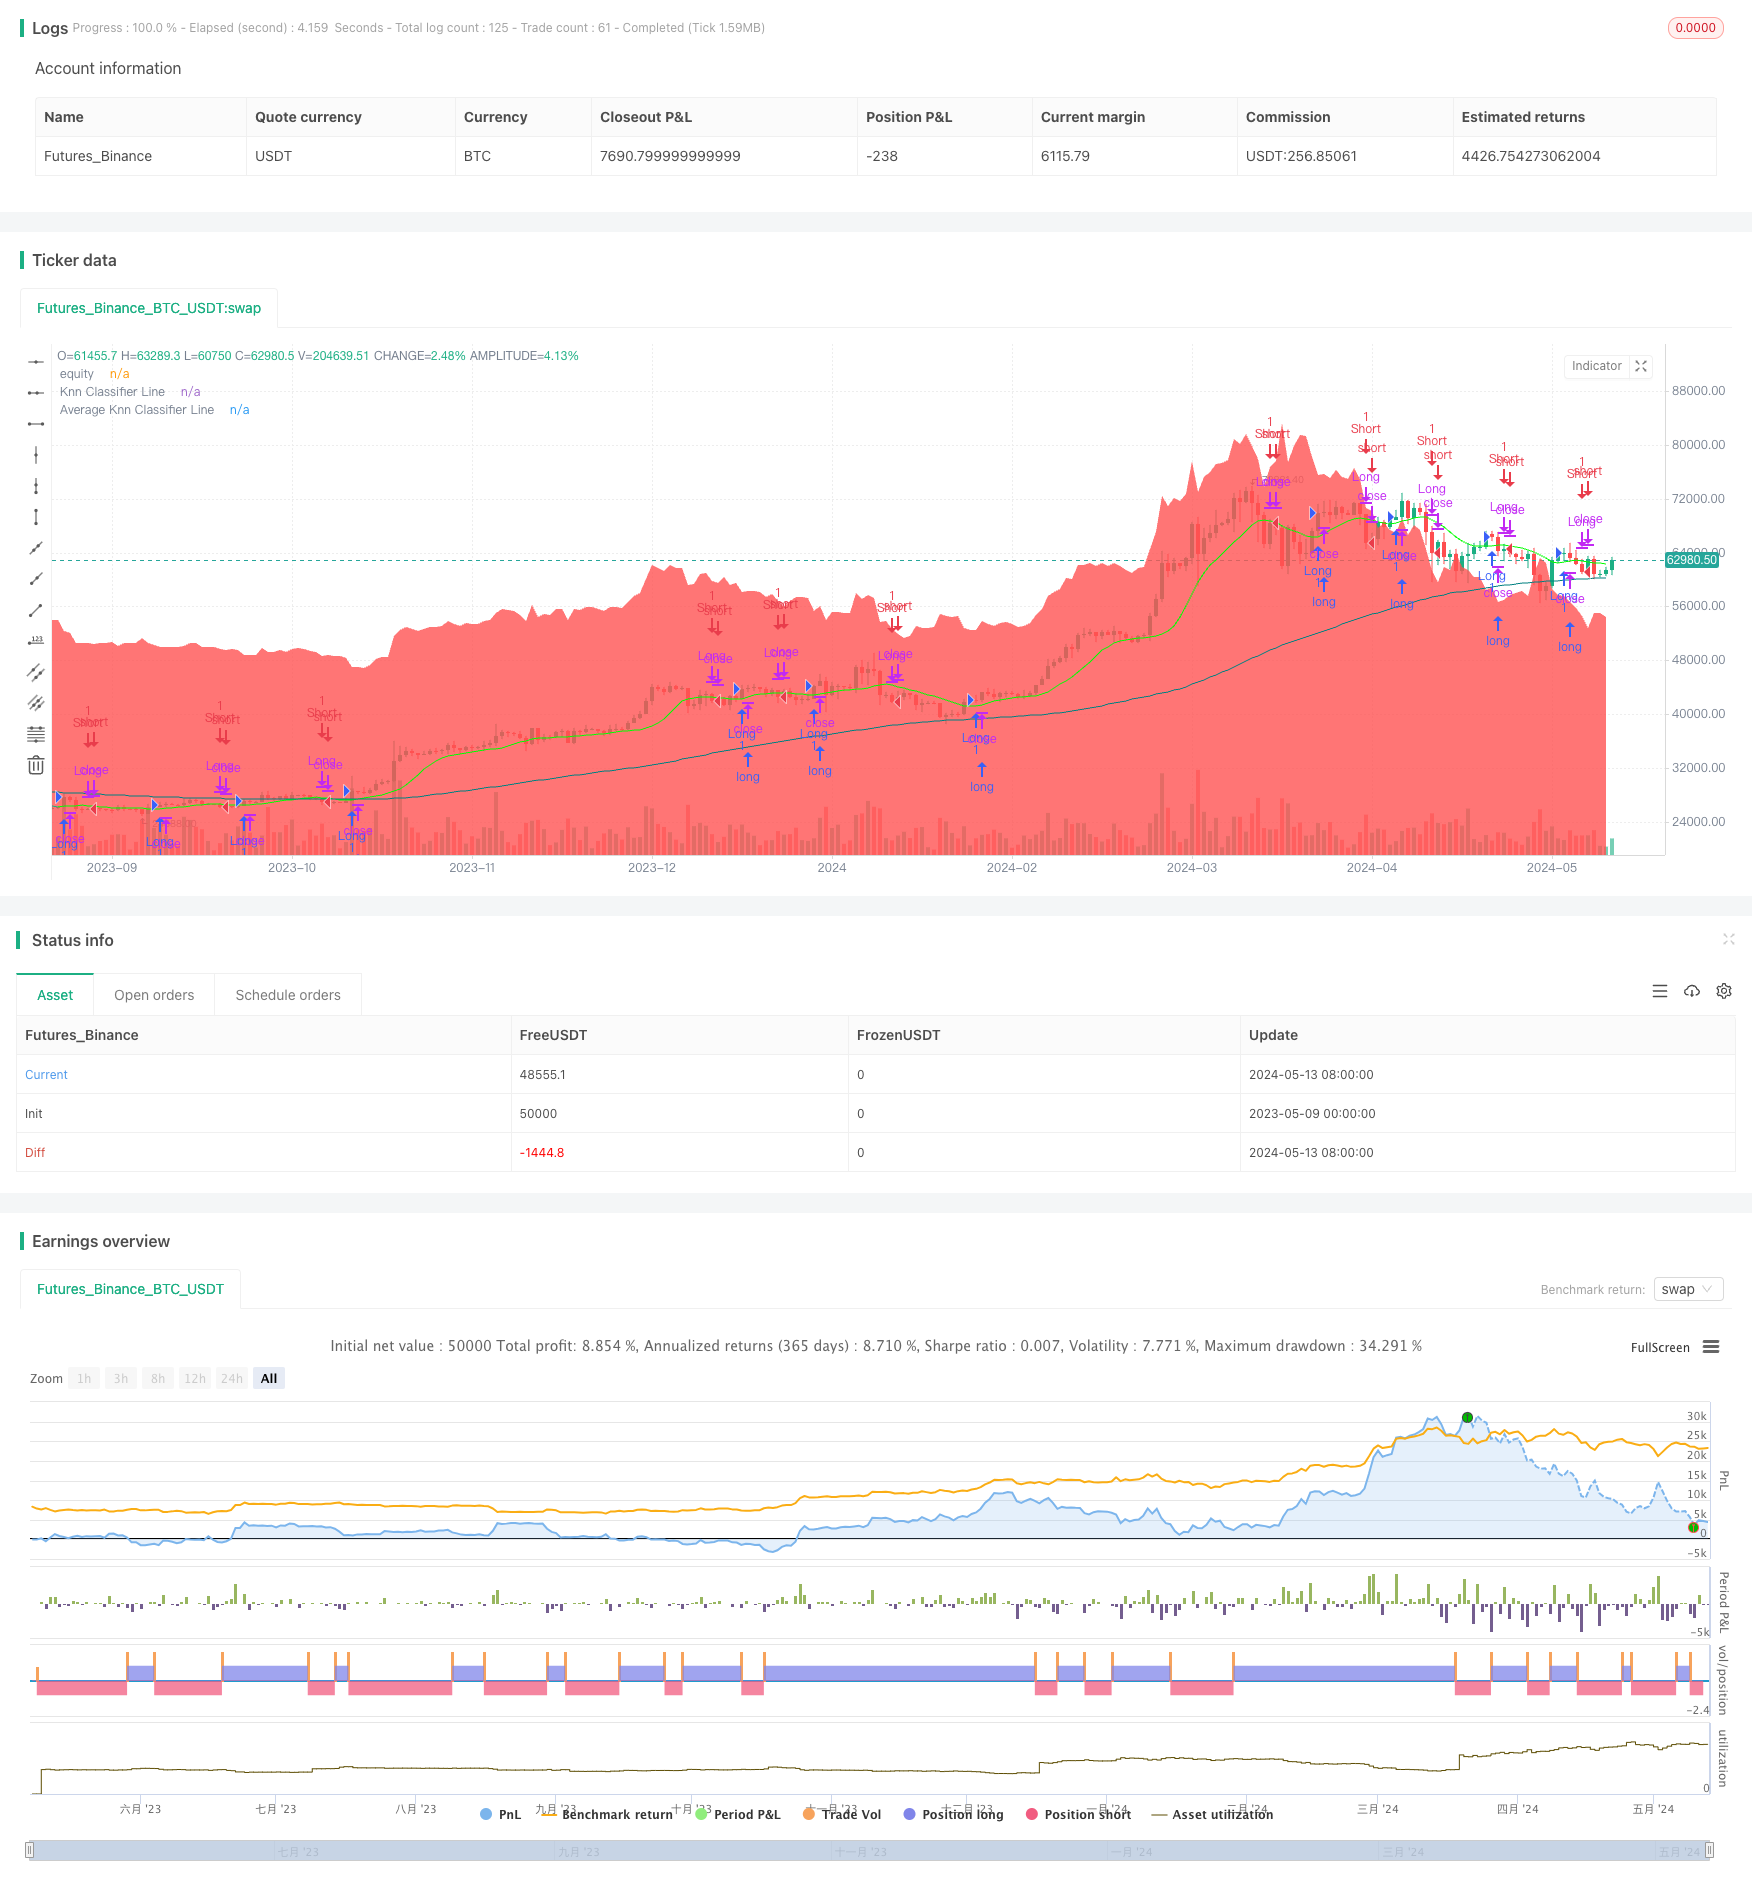
この戦略は,Kの近隣 (KNN) の機械学習アルゴリズムを使用して,価格の傾向を予測する.異なる価格計算方法 (例えばHL2,VWAP,SMAなど) を入力値として選択し,異なる目標値 (例えば価格の動き,VWAP,変動率など) を評価対象として選択することで,KNのアルゴリズムを使用して,現在の市場状態に最も近いKの歴史的データポイントを見つけ,このKのデータポイントのトレンド方向に基づいて多空の予測を行う.同時に,戦略は,予測の安定性を高めるために,移動平均線を使用して予測結果を平行処理する.
戦略原則
- 価格計算方法 (HL2,VWAP,SMAなど) を KNN アルゴリズムの入力値として選択する.
- 評価目標 (価格動向,VWAP,波動率など) をKNNアルゴリズムの目標値として選択する.
- 最寄りの数 K 及び滑り周期を設定して,KNN アルゴリズムの感度と予測結果の滑り度を調整する.
- 各新しい価格データポイントに対して,KNNアルゴリズムは,現在の市場状態に最も近いKのデータポイントを歴史的データから探します.
- このKのデータポイントのトレンド方向 ((多頭または空頭) に基づいて投票し,現在の市場のトレンド予測が得られます.
- 予測の安定性を高めるために,予測結果を移動平均で平滑に処理する.
- 調整後の予測結果に基づいて取引シグナルを生成し,背景の色の変化で直感的に現在の市場トレンド予測を表示する.
優位分析
- 機械学習アルゴリズムを使用し,歴史的なデータから学習し,価格の傾向を予測し,一定の適応性と柔軟性を持っています.
- 戦略のパフォーマンスを最適化し,異なる市場状況に適応するために,入力値,ターゲット値,近隣数,滑り回路などのパラメータを調整することができます.
- 予測結果を移動平均と組み合わせることで,予測の安定性と信頼性が向上する.
- 背景の色の変化によって,現在の市場トレンドの予測を直感的に表示し,トレーダーが市場状態を迅速に判断し,意思決定を容易にします.
リスク分析
- KNNアルゴリズムの予測性能は,歴史的データの質と代表性に依存し,歴史的データが不足または非代表性であれば,予測結果が不正確になる可能性があります.
- 策略のパフォーマンスはパラメータ設定によって影響され,不適切なパラメータの組み合わせは,策略の不良なパフォーマンスを引き起こすか,オーバーフィットを生じさせる可能性があります.
- 市場トレンドが急激に変化したり,ブラック・スウィングが発生したりすると,歴史データに基づく予測が失敗し,戦略が誤った取引シグナルを生み出します.
最適化の方向
- 予測の正確性と安定性を高めるために,KNNアルゴリズムの入力として,より多くの技術指標または市場情緒データを導入します.
- 市場状況や変動のレベルに合わせて,自己適応メカニズムを使用して戦略パラメータを動的に調整する.
- 他の技術分析方法やリスク管理策と組み合わせて,戦略のリスクの口を小さくし,収益の安定性を高める.
要約する
この戦略は,KNNの機械学習アルゴリズムを価格トレンド予測に適用することで,市場トレンドを把握し,取引シグナルを生成するために,歴史的なデータと統計学的方法を使用する方法を示しています.戦略の優点は,その適応性と柔軟性であり,パラメータ調整によってパフォーマンスを最適化し,異なる市場状況に適応することができます.しかし,戦略のリスクは,主に歴史的データの質と代表性,およびパラメータ設定の合理性から生じます.
ストラテジーソースコード
/*backtest
start: 2023-05-09 00:00:00
end: 2024-05-14 00:00:00
period: 1d
basePeriod: 1h
exchanges: [{"eid":"Futures_Binance","currency":"BTC_USDT"}]
*/


// This work is licensed under a Attribution-NonCommercial-ShareAlike 4.0 International (CC BY-NC-SA 4.0) https://creativecommons.org/licenses/by-nc-sa/4.0/
// © Blake_22 {

//@version=5
strategy('money printer part 1', overlay=true)

// ~~ Tooltips {
t1 ="PriceValue selects the method of price computation. \n\nSets the smoothing period for the PriceValue. \n\nAdjusting these settings will change the input values for the K-Nearest Neighbors algorithm, influencing how the trend is calculated."
t2 = "TargetValue specifies the target to evaluate. \n\nSets the smoothing period for the TargetValue."
t3 ="numberOfClosestValues sets the number of closest values that are considered when calculating the KNN Moving Average. Adjusting this number will affect the sensitivity of the trend line, with a higher value leading to a smoother line and a lower value resulting in a line that is more responsive to recent price changes."
t4 ="smoothingPeriod sets the period for the moving average applied to the KNN classifier. Adjusting the smoothing period will affect how rapidly the trend line responds to price changes, with a larger smoothing period leading to a smoother line that may lag recent price movements, and a smaller smoothing period resulting in a line that more closely tracks recent changes."
t5 ="This option controls the background color for the trend prediction. Enabling it will change the background color based on the prediction, providing visual cues on the direction of the trend. A green color indicates a positive prediction, while red indicates a negative prediction."
//~~~~~~~~~~~~~~~~~~~~~~~~~~~~~~~~~~~~~~~~~~~~~~~~~~~~~~~~~~~~~~~~~~~~~~~~~~~~~~~~~~~~~~~~~~~~~~~~~~~~~~~~~~~~~~~~~~~~~}

// ~~ Inputs {
PriceValue   = input.string("hl2", options = ["hl2","VWAP", "sma", "wma", "ema", "hma"], group="", inline="Value")
maLen        = input.int(5, minval=2, maxval=200, title="", group="", inline="Value", tooltip=t1)
TargetValue  = input.string("Price Action", options = ["Price Action","VWAP", "Volatility", "sma", "wma", "ema", "hma"], group="", inline="Target")
maLen_       = input.int(5, minval=2, maxval=200, title="", group="", inline="Target", tooltip=t2)
// Input parameters for the KNN Moving Average
numberOfClosestValues = input.int(3, "Number of Closest Values", 2, 200, tooltip=t3)
smoothingPeriod       = input.int(50, "Smoothing Period", 2, 500, tooltip=t4)
windowSize            = math.max(numberOfClosestValues, 30)

// knn Color
Upknn_col   = input.color(color.lime, title="", group="KNN Color", inline="knn col")
Dnknn_col   = input.color(color.red, title="", group="KNN Color", inline="knn col")
Neuknn_col  = input.color(color.orange, title="", group="KNN Color", inline="knn col")
// MA knn Color
Maknn_col   = input.color(color.teal, title="", group="MA KNN Color", inline="MA knn col")
// BG Color
bgcolor = input.bool(false, title="Trend Prediction Color", group="BG Color", inline="bg", tooltip=t5)
Up_col  = input.color(color.lime, title="", group="BG Color", inline="bg")
Dn_col  = input.color(color.red, title="", group="BG Color", inline="bg")
//~~~~~~~~~~~~~~~~~~~~~~~~~~~~~~~~~~~~~~~~~~~~~~~~~~~~~~~~~~~~~~~~~~~~~~~~~~~~~~~~~~~~~~~~~~~~~~~~~~~~~~~~~~~~~~~~~~~~~}

// ~~ kNN Classifier {
value_in = switch PriceValue
    "hl2"  => ta.sma(hl2,maLen)
    "VWAP" => ta.vwap(close[maLen])
    "sma" => ta.sma(close,maLen)
    "wma" => ta.wma(close,maLen)
    "ema" => ta.ema(close,maLen)
    "hma" => ta.hma(close,maLen)

meanOfKClosest(value_,target_) =>
    closestDistances = array.new_float(numberOfClosestValues, 1e10)
    closestValues    = array.new_float(numberOfClosestValues, 0.0)
    for i = 1 to windowSize
        value = value_[i]
        distance = math.abs(target_ - value)
        maxDistIndex = 0
        maxDistValue = closestDistances.get(0)
        for j = 1 to numberOfClosestValues - 1
            if closestDistances.get(j) > maxDistValue
                maxDistIndex := j
                maxDistValue := closestDistances.get(j)
        if distance < maxDistValue
            closestDistances.set(maxDistIndex, distance)
            closestValues.set(maxDistIndex, value)
    closestValues.sum() / numberOfClosestValues

// Choose the target input based on user selection
target_in = switch TargetValue
    "Price Action"  => ta.rma(close,maLen_)
    "VWAP"          => ta.vwap(close[maLen_])
    "Volatility"    => ta.atr(14)
    "sma" => ta.sma(close,maLen_)
    "wma" => ta.wma(close,maLen_)
    "ema" => ta.ema(close,maLen_)
    "hma" => ta.hma(close,maLen_)

knnMA = meanOfKClosest(value_in,target_in)
//~~~~~~~~~~~~~~~~~~~~~~~~~~~~~~~~~~~~~~~~~~~~~~~~~~~~~~~~~~~~~~~~~~~~~~~~~~~~~~~~~~~~~~~~~~~~~~~~~~~~~~~~~~~~~~~~~~~~~}

// ~~ kNN Prediction {
// Function to calculate KNN Classifier
price = math.avg(knnMA, close)
c     = ta.rma(knnMA[1], smoothingPeriod)
o     = ta.rma(knnMA, smoothingPeriod)

// Defines KNN function to perform classification
knn(price) =>
    Pos_count = 0
    Neg_count = 0
    min_distance = 10e10
    nearest_index = 0
    for j = 1 to 10
        distance = math.sqrt(math.pow(price[j] - price, 2))
        if distance < min_distance
            min_distance := distance
            nearest_index := j
            Neg = c[nearest_index] > o[nearest_index]
            Pos = c[nearest_index] < o[nearest_index]
            if Pos
                Pos_count += 1
            if Neg
                Neg_count += 1
    output = Pos_count>Neg_count?1:-1

// Calls KNN function and smooths the prediction
knn_prediction_raw = knn(price)
knn_prediction     = ta.wma(knn_prediction_raw, 3)
//~~~~~~~~~~~~~~~~~~~~~~~~~~~~~~~~~~~~~~~~~~~~~~~~~~~~~~~~~~~~~~~~~~~~~~~~~~~~~~~~~~~~~~~~~~~~~~~~~~~~~~~~~~~~~~~~~~~~~}

// ~~ Plots {
// Plots for display on the chart
knnMA_          = ta.wma(knnMA,5)
knnMA_col       = knnMA_>knnMA_[1]?Upknn_col:knnMA_<knnMA_[1]?Dnknn_col:Neuknn_col
Classifier_Line = plot(knnMA_,"Knn Classifier Line", knnMA_col)
MAknn_          = ta.rma(knnMA, smoothingPeriod)
plot(MAknn_,"Average Knn Classifier Line" ,Maknn_col)
green = knn_prediction < 0.5
red   = knn_prediction > -0.5
bgcolor( green and bgcolor? color.new(Dn_col,80) :
 red and bgcolor ? color.new(Up_col,80) : na)
//~~~~~~~~~~~~~~~~~~~~~~~~~~~~~~~~~~~~~~~~~~~~~~~~~~~~~~~~~~~~~~~~~~~~~~~~~~~~~~~~~~~~~~~~~~~~~~~~~~~~~~~~~~~~~~~~~~~~~}

// ~~ Alerts {
knnMA_cross_Over_Ma      = ta.crossover(knnMA_,MAknn_)
knnMA_cross_Under_Ma     = ta.crossunder(knnMA_,MAknn_)
knnMA_cross_Over_Close   = ta.crossover(knnMA_,close)
knnMA_cross_Under_Close  = ta.crossunder(knnMA_,close)
knnMA_Switch_Up          = knnMA_[1]<knnMA_ and knnMA_[1]<=knnMA_[2]
knnMA_Switch_Dn          = knnMA_[1]>knnMA_ and knnMA_[1]>=knnMA_[2]
knnMA_Neutral            = knnMA_col==Neuknn_col and knnMA_col[1]!=Neuknn_col
greenBG                  = green and not green[1]
redBG                    = red and not red[1]

alertcondition(knnMA_cross_Over_Ma,  title = "Knn Crossover Average Knn",  message = "Knn Crossover Average Knn")
alertcondition(knnMA_cross_Under_Ma, title = "Knn Crossunder Average Knn", message = "Knn Crossunder Average Knn")
alertcondition(knnMA_cross_Over_Close,  title = "Knn Crossover Close",  message = "Knn Crossover Close")
alertcondition(knnMA_cross_Under_Close, title = "Knn Crossunder Close", message = "Knn Crossunder Close")
alertcondition(knnMA_Switch_Up,  title = "Knn Switch Up",  message = "Knn Switch Up")
alertcondition(knnMA_Switch_Dn, title = "Knn Switch Dn", message = "Knn Switch Dn")
alertcondition(knnMA_Neutral, title = "Knn is Neutral", message = "Knn is Neutral")
alertcondition(greenBG, title = "Positive Prediction", message = "Positive Prediction")
alertcondition(redBG, title = "Negative Prediction", message = "Negative Prediction")
//~~~~~~~~~~~~~~~~~~~~~~~~~~~~~~~~~~~~~~~~~~~~~~~~~~~~~~~~~~~~~~~~~~~~~~~~~~~~~~~~~~~~~~~~~~~~~~~~~~~~~~~~~~~~~~~~~~~~~}

//~~Trenddilo {


//~~~~~~~~~~~~~~~~~~~~~~~~~~~~~~~~~~~~~~~~~~~~~~~~~~~~~~~~~~~~~~~~~~~~~~~~~~~~~~~~~~~~~~~~~~~~~~~~~~~~~~~~~~~~~~~~~~~~~}


//~~ strategy { 1

LongCondtion = knnMA_[1]<knnMA_ and knnMA_[1]<=knnMA_[2]
ShortCondtion = knnMA_[1]>knnMA_ and knnMA_[1]>=knnMA_[2]


//SecondaryLongCondtion = col == color.lime
//SecondaryShortCondtion = col == color.red

strategy.entry("Long", strategy.long, when = LongCondtion)
strategy.close("Long", when =ShortCondtion)

strategy.entry("Short", strategy.short, when =ShortCondtion)
strategy.close("short", when =LongCondtion)


plot(strategy.equity, title="equity", color=color.red, linewidth=2, style=plot.style_areabr)
//~~~~~~~~~~~~~~~~~~~~~~~~~~~~~~~~~~~~~~~~~~~~~~~~~~~~~~~~~~~~~~~~~~~~~~~~~~~~~~~~~~~~~~~~~~~~~~~~~~~~~~~~~~~~~~~~~~~~~}