1
フォロー
1750
フォロワー
概要
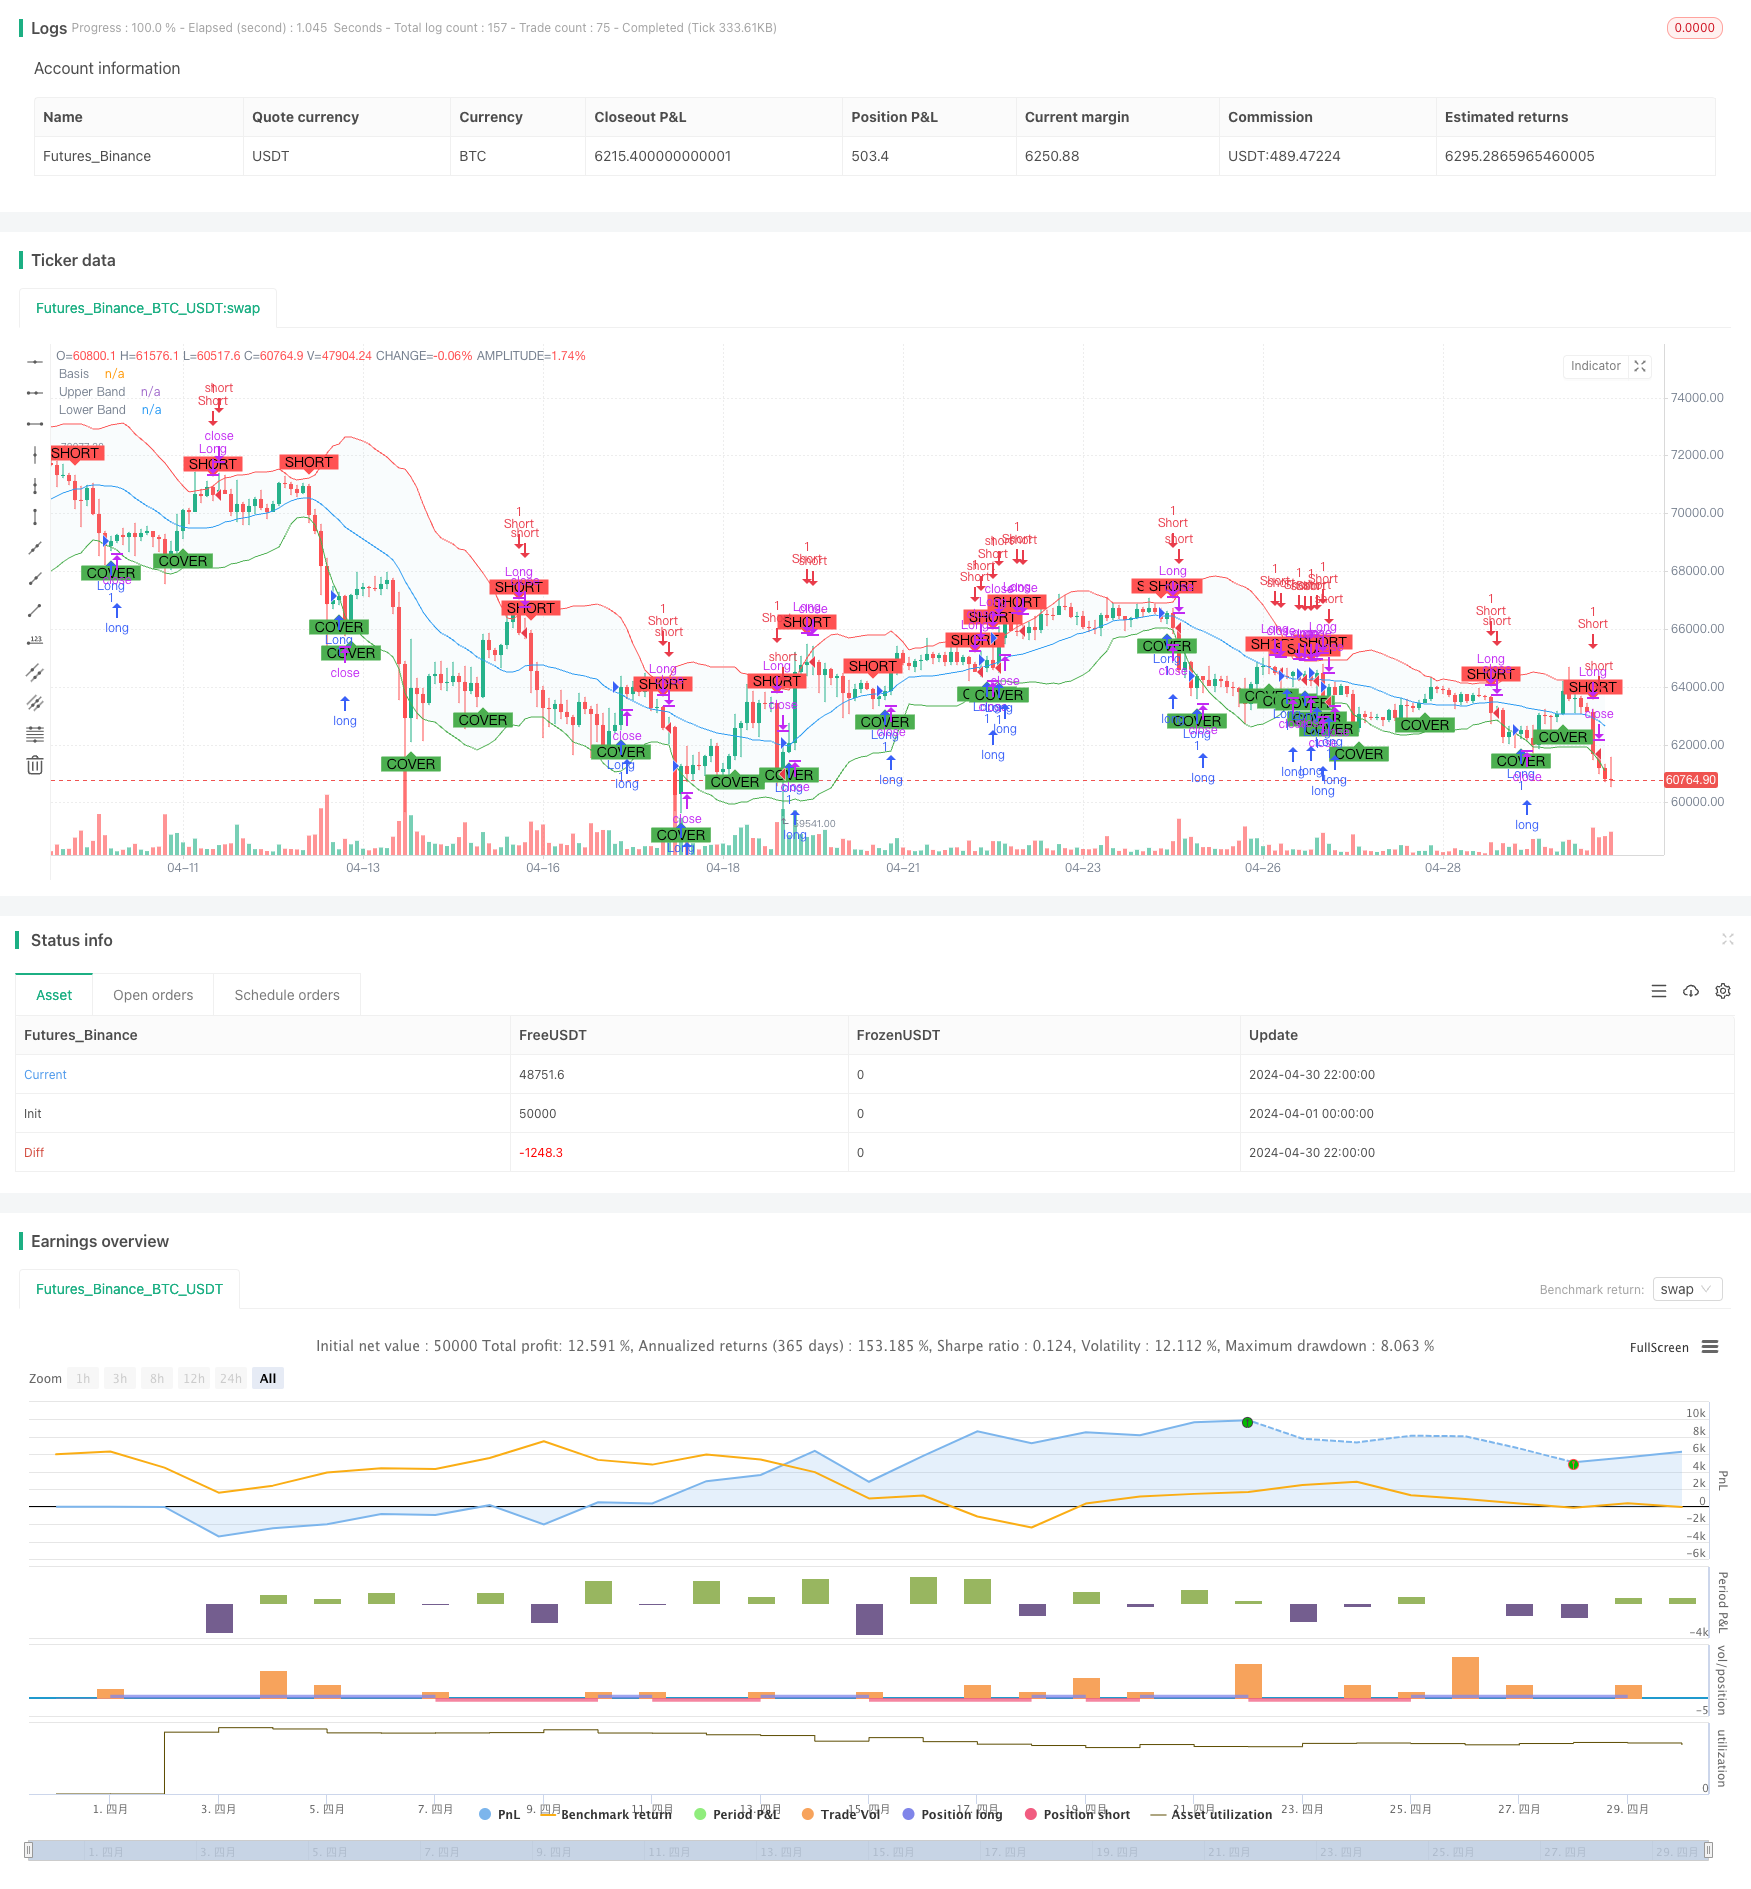
この戦略はブリン帯指数に基づいており,上位,下位,中位相対の価格の動きを分析することによって,最適な買入機会を識別する. この戦略は,多頭と空頭のポジションを同時に管理し,さまざまな市場方向から利益を得ることを可能にします. この戦略のパラメータは,異なるリスク承受能力と市場方法に対応するためにカスタマイズできます.
戦略原則
- 価格が上下軌道または中軌道を通過すると,買取シグナルが生成され,上昇傾向が起こりうることを示します.
- 価格が軌道上または軌道中に入ると,セールシグナルが誘発され,下落傾向が起こりうることを予告する.
- 価格が軌道上または軌道中に入るとき,空調信号を起動し,下落する市場から利益を得ることができます.
- 価格が上下軌道や中軌道に突入すると,平仓シグナルを活性化して,空頭ポジションを平らにして利益をロックするか,損失を減らすことを提示します.
戦略的優位性
- 信頼性の高い技術分析の原則に基づいて,厳格なテストを経て,信頼性と有効性を保証します.
- 簡単にTradingViewで実装してカスタマイズでき,あらゆるレベルの経験を持つトレーダーに適しています.
- 継続的なサポートと更新により,変化する市場条件に適応し,戦略の最適なパフォーマンスを維持します.
- ダイナミックな入場・出場点を提供し,ブリン帯の上線,下線,中線に対する価格変動を分析することで,最も有利なタイミングで取引を終了することを保証する.
- 集積された多頭と空頭のポジション管理は,市場の傾向に関係なく,あらゆる方向から利益を得ることができます.
戦略リスク
- 波動的な市場条件下では,頻繁な取引シグナルが過剰取引と潜在的損失につながる可能性があります.
- 戦略は歴史的なデータと統計分析に依存しており,市場における不合理な行動や黒天事件を完全に捉えることはできません.
- パラメータの不適切な選択は,戦略の不良なパフォーマンスを引き起こす可能性があります.特定の市場と取引スタイルに適合するために,パラメータを注意深く最適化して反測する必要があります.
- すべての市場条件において優れたパフォーマンスを示す単一の戦略はありません. ブリン・バンド戦略は,特定の状況で不良なパフォーマンスを発揮することがあり,他の指標とリスク管理技術との組み合わせが推奨されています.
戦略最適化の方向性
- RSI,MACDなどより信頼性の高い取引シグナルを識別するために,より多くの指標の組み合わせロジックを追加します.これは,ノイズをフィルターし,誤報を減らすのに役立ちます.
- 市場状況の動向に合わせてブリン帯の幅を調整する自主的な変動計算を導入することを検討する.これは,異なる変動率の環境下での機会をよりよく捉える.
- ATRまたはパーセントに基づくストップ・アンド・ストップ・メカニズムを導入し,リスクをより良く管理し,利益を保護します.これは潜在的な損失を制限し,既得利益をロックするのに役立ちます.
- 市場周期や波動率状態に基づくダイナミックなポジション調整を探索する.異なる市場情勢に応じて資本を配分し,リスク調整後の利益を最適化することができる.
要約する
ブリンベルト戦略は,価格とブリンベルトの相対的な動きに基づいて正確な取引シグナルを生成するための強力な枠組みを提供します. 多頭と空頭のポジション管理,カスタマイズされたパラメータ,および直感的な視覚と警告機能を統合することにより,この戦略は,さまざまな市場条件下で,トレーダーに自信を持ってチャンスを掴むことを可能にします. この戦略は,優れたパフォーマンスを発揮しているにもかかわらず,追加の指標,ダイナミックな変動率の計算,強力なリスク管理技術,市場状況に基づく自主的なポジション調整の導入などの最適化のための余地があります.
ストラテジーソースコード
/*backtest
start: 2024-04-01 00:00:00
end: 2024-04-30 23:59:59
period: 2h
basePeriod: 15m
exchanges: [{"eid":"Futures_Binance","currency":"BTC_USDT"}]
*/

//@version=5
strategy("Bollinger Bands Strategy with Long and Short", overlay=true)

// Bollinger Bands settings
length = input.int(20, title="BB Length")
src = input(close, title="Source")
mult = input.float(2.0, title="BB Multiplier")

// Calculate Bollinger Bands
basis = ta.sma(src, length)
dev = mult * ta.stdev(src, length)
upper = basis + dev
lower = basis - dev

// Plot Bollinger Bands
plot(basis, color=color.blue, linewidth=1, title="Basis")
p1 = plot(upper, color=color.red, linewidth=1, title="Upper Band")
p2 = plot(lower, color=color.green, linewidth=1, title="Lower Band")
fill(p1, p2, color=color.rgb(173, 216, 230, 90))

// Long Buy and Sell conditions
buyConditionLower = ta.crossover(src, lower)
sellConditionUpper = ta.crossunder(src, upper)
buyConditionBasis = ta.crossover(src, basis)
sellConditionBasis = ta.crossunder(src, basis)

// Combine long conditions
buyCondition = buyConditionLower or buyConditionBasis
sellCondition = sellConditionUpper or sellConditionBasis

// Short Sell and Buy conditions
shortConditionUpper = ta.crossunder(src, upper)
coverConditionLower = ta.crossover(src, lower)
shortConditionBasis = ta.crossunder(src, basis)
coverConditionBasis = ta.crossover(src, basis)

// Combine short conditions
shortCondition = shortConditionUpper or shortConditionBasis
coverCondition = coverConditionLower or coverConditionBasis

// Execute strategy orders for long
if (buyCondition)
    strategy.entry("Long", strategy.long)
if (sellCondition)
    strategy.close("Long")

// Execute strategy orders for short
if (shortCondition)
    strategy.entry("Short", strategy.short)
if (coverCondition)
    strategy.close("Short")

// Plot Buy and Sell signals for long
plotshape(series=buyCondition, location=location.belowbar, color=color.green, style=shape.labelup, text="BUY", title="Buy Signal")
plotshape(series=sellCondition, location=location.abovebar, color=color.red, style=shape.labeldown, text="SELL", title="Sell Signal")

// Plot Sell and Cover signals for short
plotshape(series=shortCondition, location=location.abovebar, color=color.red, style=shape.labeldown, text="SHORT", title="Short Signal")
plotshape(series=coverCondition, location=location.belowbar, color=color.green, style=shape.labelup, text="COVER", title="Cover Signal")

// Alert conditions for long
alertcondition(buyCondition, title="Buy Alert", message="Price crossed above the lower Bollinger Band or Basis")
alertcondition(sellCondition, title="Sell Alert", message="Price crossed below the upper Bollinger Band or Basis")

// Alert conditions for short
alertcondition(shortCondition, title="Short Alert", message="Price crossed below the upper Bollinger Band or Basis")
alertcondition(coverCondition, title="Cover Alert", message="Price crossed above the lower Bollinger Band or Basis")