ワンクラウド複数移動平均取引戦略

1
Follow
1781
Followers
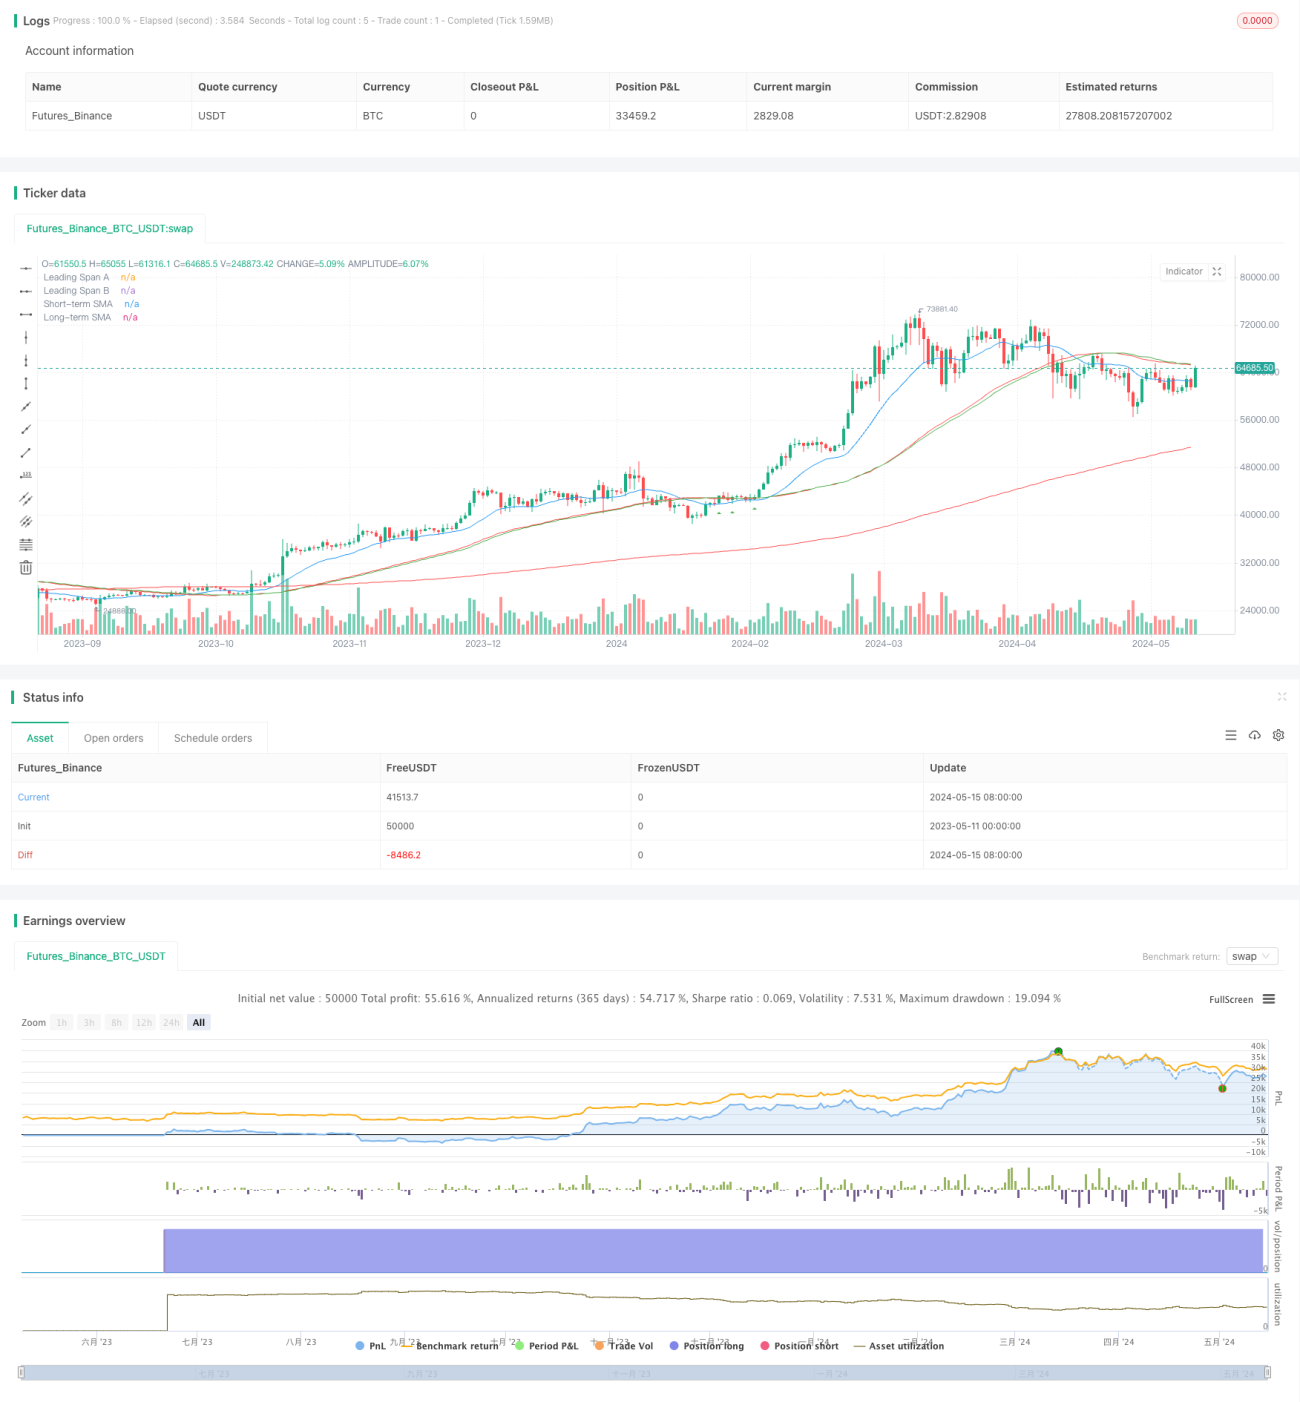
概要
この戦略は,一見均衡図雲と短期 (<=55) と長期 (<=200) の単純な移動平均 (<=SMA) を組み合わせて,潜在的な買入シグナルを識別する.買入シグナルには,雲層と長期SMAよりも高い価格が必要で,短期SMAを上を通過した後,短期SMAを踏む必要がある.売出シグナルには,雲層と長期SMAを下を通過した後,短期SMAを踏む必要がある.この戦略は,横断市場または重大ニュースイベントの間にシグナルを生成することを避ける.これらの期間に偽のシグナルが多くあるため,この戦略は,1時間および2時間の時間枠で最高のパフォーマンスを示している.
戦略原則
この戦略は以下の原則に基づいています.
- 価格が雲層と長期SMAより高いとき,市場は上昇傾向にある.
- 価格がクラウドと長期SMAより低いとき,市場は下落傾向にある.
- 短期SMAの上昇と下落は,トレンドを確認し,短期SMAを踏むことは低リスクの入場機会を提供します.
- 横盤市場や重大ニュースイベントの時には偽信号が多く,取引は避けるべきです.
プログラムはまず,必要な一目的なクラウド構成要素 ((変換線,基準線,先行スパンAおよびB),および短期および長期のSMAを計算する. そして,価格の雲層および均等線に対する位置を識別するために複数の条件を定義する. すべての買入/売却条件が満たされると,プログラムはそれぞれ買入と売却の信号を生成する.
戦略的優位性
- 複数の指標を組み合わせてトレンドを確認することで,信号の信頼性が向上する.一目瞭然の雲は多くのノイズをフィルターし,SMA交差はトレンドを確認する.
- 確認されたトレンドの中で,平均線を踏むチャンスを探すリスクは比較的低い.
- 横断市場や重大ニュースイベントの際に取引を避けることで,偽信号のリスクをさらに低減します.
- 1時間や2時間などの中長期取引に適しており,大きなトレンドを把握して利益の余地がある.
戦略リスク
- トレンド転換期には損失が発生する可能性がある。平均線交差と雲層突破がトレンドを確認するにもかかわらず,遅れは依然として存在する。
- 明確な止損位置がない.現行の条件は,入場時刻を重視しているが,出場位置を明確に定義していない.
- 参数選択は主観的で不確実性がある. 雲層参数,平均線長などの異なる選択は,戦略のパフォーマンスに影響する.
戦略最適化の方向性
- 特定のストップポジション,例えばブレイク前低/前高,ATR倍数などの追加は,単一取引のリスクを低減する.
- MACD,DMIなどの他のトレンド確認指標と比較して,より安定した信頼性の高い信号の組み合わせを形成します.
- パラメータを最適化して,最適なパラメータの組み合わせを見つけ,様々な市場状況下での戦略の適応性を向上させる.
- トレンド市場と振動市場を区別し,トレンド市場では積極的に入場し,振動市場では取引頻度を適切に低下させる.
要約する
この"一雲多均線取引戦略"は,一目平衡グラフ雲と簡易移動平均を組み合わせて,既定のトレンドの中で反転均線を踏む低リスクの入場機会を探している.横断市場と重大ニュースイベントの間の取引をフィルタリングすることによって,この戦略は偽信号のリスクを軽減し,その結果,全体的なパフォーマンスを向上させる.この戦略は,主に中長期の取引を行う者に適用され,1時間および2時間などの時間枠で良好なパフォーマンスを発揮している.しかし,この戦略には,明確なストップ・ロスの導入,信号の最適化,対参数調節などのさらなる最適化の余地がある.
Source
Pine
Strategy parameters
Related strategies
Comment
All comments (0)
No data
- 1