価格ボリュームブレイクアウト購入戦略

1
Follow
1781
Followers
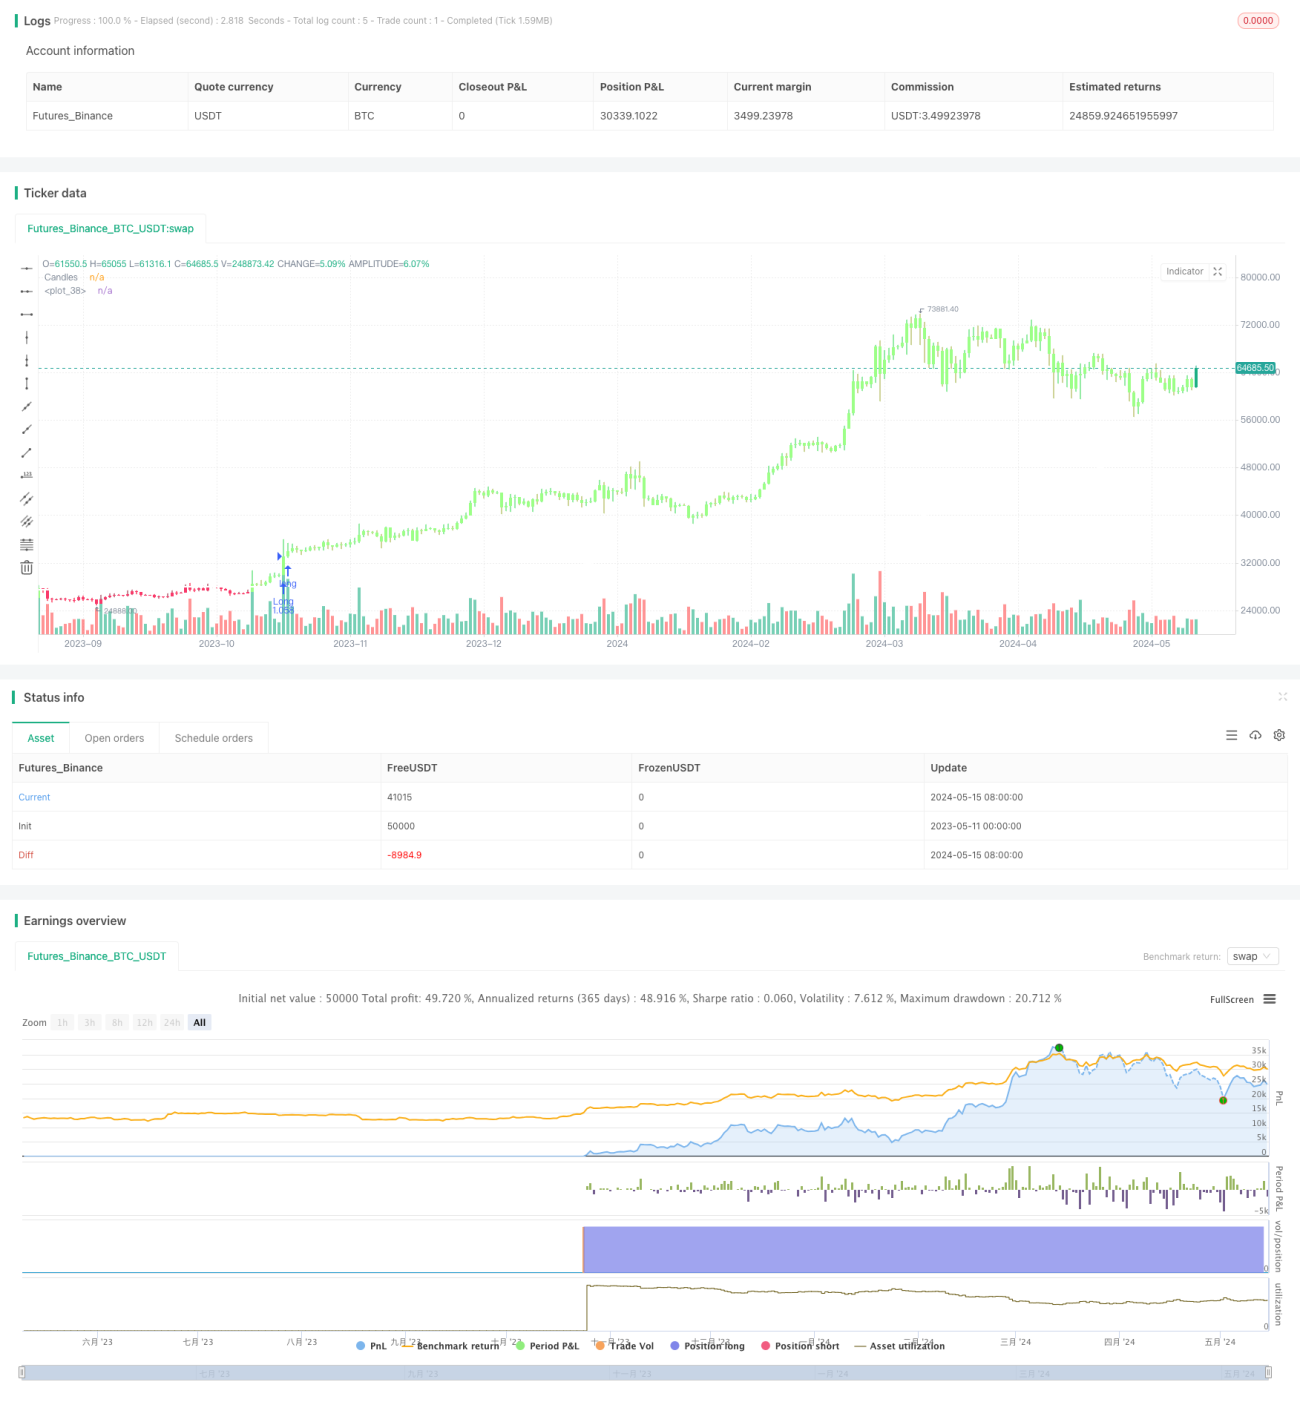
概要
"価格突破買取戦略"は,指定されたグラフ範囲で同時に価格と取引量の突破が起こるのを検出することによって買取機会を識別することを目的とした取引戦略である.この戦略は,まず,価格と取引量のチェックウィンドウとして特定の数の<unk>線を使用する.これらの値は,突破条件を識別するために基準として使用される.
戦略原則
- チェックウィンドウとして価格突破周期と取引量突破周期を設定します.
- 価格の突破期間の最高値と最低値を取得する.
- 取引量突破期間の最高取引量を取得する.
- 閉店価格が前期最高価格より高く,取引量が前期最高取引量より高く,閉店価格がトレンドライン長さのSMAより高く,現在開場取引がなく,注文方向が空白でないと設定されている場合,多額の取引を開始します.
- トレンドラインの長さ以下で5日間連続でSMAを閉じた場合,すべての多頭ポジションを平らにする.
- 閉盤価格が前期の最低価格より低く,取引量は前期の最高取引量より高く,閉盤価格がトレンドラインの長さのSMAより低く,現在開口取引がなく,注文方向設定が多すぎない場合,空白を開始します.
- 5日連続でトレンドラインの長さより高い終止価格のSMAがあれば,すべての空頭ポジションを平らにする.
戦略的優位性
- また,価格と取引量の突破を買い買い信号として使用することで,トレンドの転換をよりよく確認できます.
- ポジションを開く前に,取引が主要市場のトレンドに合致していることを確認するために,価格が長期SMAより高くまたは低いかどうかをチェックします.
- SMAを横断した連続した多日間の閉店価格を平仓の信号として設定することで,トレンドの終わりを効果的に捉えることができます.
- ビットコインやイーサリアムなどの高波動性資産は,市場の突然の価格や取引量の変化を利用して利益を得ることができます.
戦略リスク
- 市場波動が小さい場合や,明らかなトレンドがない場合,この戦略は,取引の頻度を高め,取引コストを増加させる可能性があります.
- S&P500のような波動性少ない市場では,この戦略の効果は暗号通貨市場ではそれほど顕著ではないかもしれません.
- この戦略は,ほとんどの取引がより長い保有期間の傾向にあるため,より高い時間枠で取引信号を少なくする可能性があります.
戦略最適化の方向性
- 異なる市場特性に応じて,価格突破周期と取引量突破周期の長さを,異なる資産の変動特性に合わせたように調整する.
- 傾向判断の正確さを高めるために,指数移動平均,MACDなどの他の傾向確認指標を使用してみてください.
- 戦略にリスク管理措置を組み込む.例えば,ストップ・ロスの設定,ポジションの動的な調整など.単一取引のリスクの<unk>を減らす.
- 持久期間が長い取引では,既得利益をより保護するために,移動停止戦略を導入することを検討することができます.
要約する
"価格突破買取戦略"は,価格と取引量の突破を同時に考慮し,長期のSMAをトレンドフィルターとして組み合わせることで,強い状況での取引機会をより良く捕捉することができる.しかし,この戦略は,トレンドが目立たないまたは波動が少ない市場ではうまく機能しない可能性があり,頻繁に取引されるリスクがあります.したがって,実際のアプリケーションでは,異なる市場特性と個人の取引スタイルに応じて,この戦略を適切に最適化して調整して,安定性と収益性を高める必要があります.
Source
Pine
Strategy parameters
Related strategies
Comment
All comments (0)
No data
- 1