EMA5とEMA13のクロスオーバー戦略

1
Follow
1781
Followers
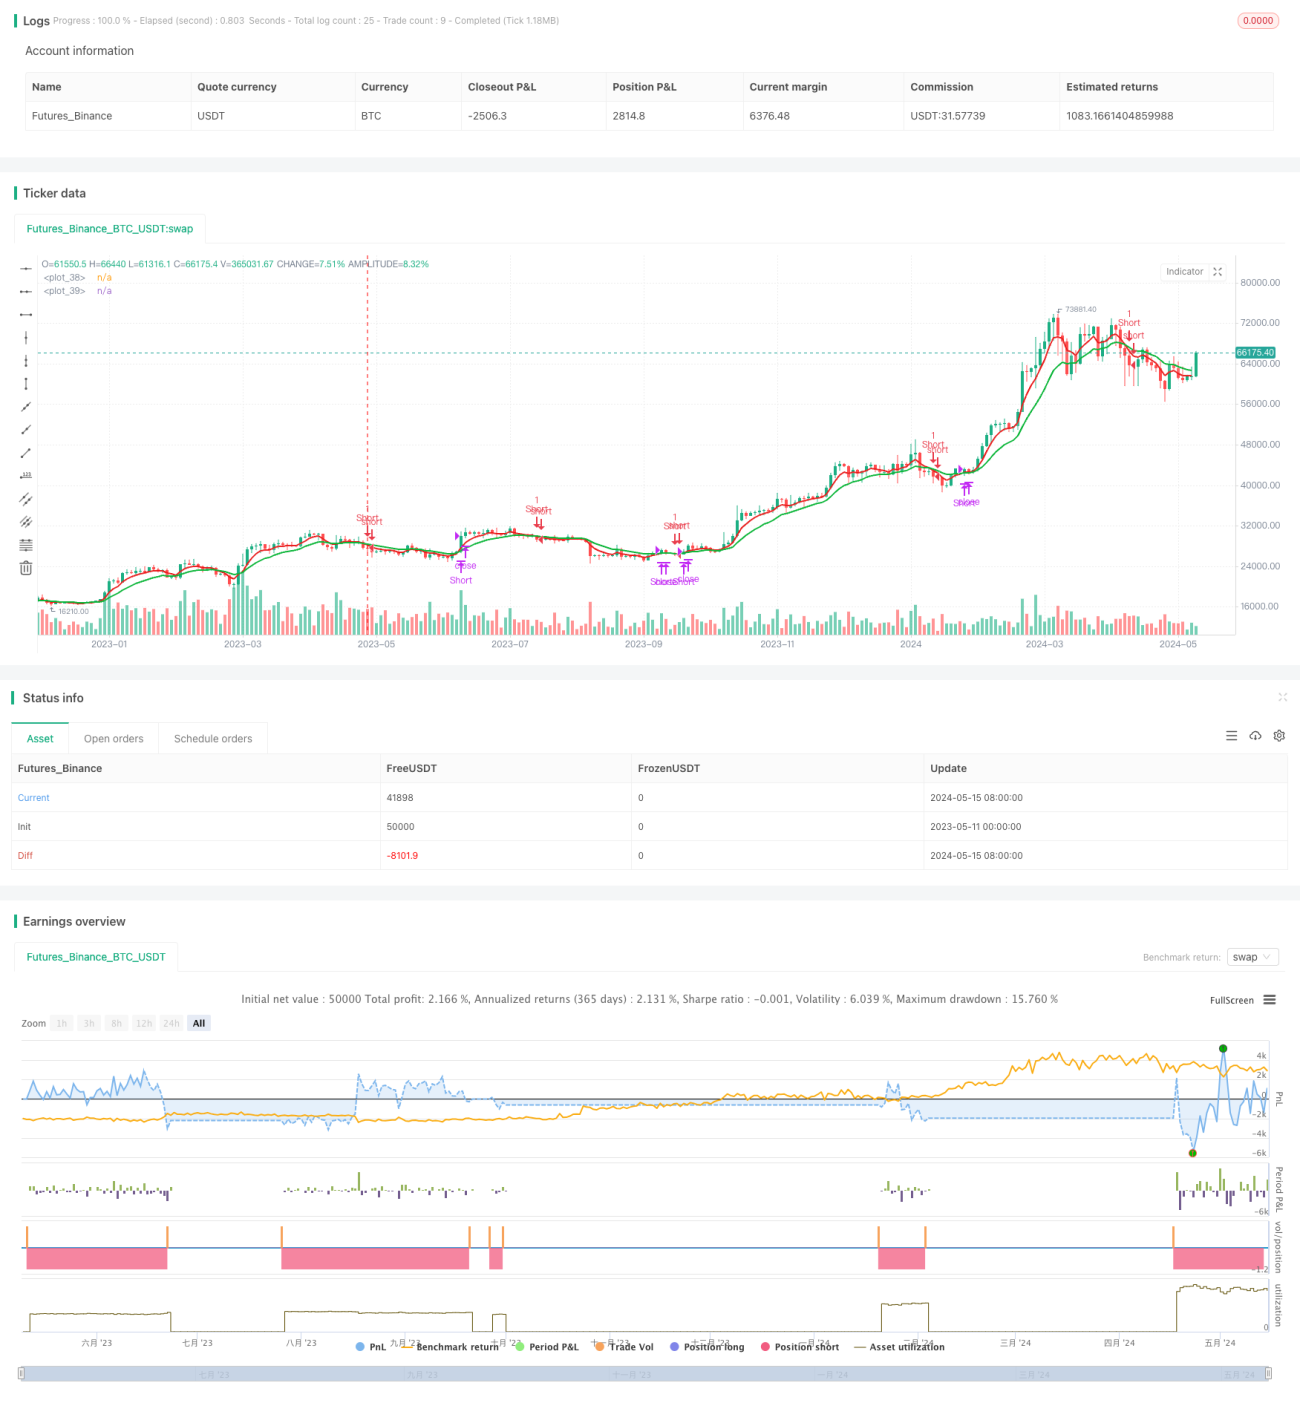
概要
この戦略は,5日目指数移動平均 ((EMA5) と13日目指数移動平均 ((EMA13) の交差を用いて取引信号を生成する.EMA5の上を穿ったとき,マルチシグナルを生成する;EMA5下を穿ったとき,空きシグナルを生成する.この戦略は,短期トレンドの変化を捉え,二つの移動平均の交差を用いて入場と出場点を決定する.
戦略原則
この戦略の核心は,2つの異なる周期の指標移動平均 (EMA) の交差を利用して取引シグナルを生成することである.EMAは一般的な技術指標であり,最近の価格データにより高い重みを与え,したがって,単純な移動平均 (SMA) に比べて価格の変化をより迅速に反映することができる.短期EMA (EMA5のような) が長期EMA (EMA13のような) を越えたときに,価格の上昇が強化され,多値シグナルが生成することを示す.逆に,短期EMAが長期EMAを越えたときに,価格の下落が強化され,空きシグナルが生成することを示す.
戦略的優位性
- シンプルで理解しやすい:この戦略は2つのEMA指標のみを使用し,原理はシンプルで,理解しやすく実行できます.
- 適応性:EMAの周期パラメータを調整することで,異なる市場環境と取引品種に適応できます.
- タイム性: SMAと比較して,EMAは価格の変化により迅速に反応し,トレンドの変化を迅速に捉えるのに役立ちます.
- 拡張性:この戦略の基礎として,他の技術指標または基本要素と組み合わせて,戦略のパフォーマンスをさらに最適化することができます.
戦略リスク
- 偽信号: 変動する市場やトレンドが不明なときに,EMA交差は偽信号を多く発生させ,頻繁な取引と資金損失を引き起こす可能性があります.
- 遅滞:EMAはSMAよりも遅滞が小さいが,まだ遅滞があるため,ベストの入場時間を逃す可能性がある.
- ストップ損失の欠如:この戦略は,明確なストップ損失条件が設定されていないため,市場が逆転した場合,大きな損失を負う可能性があります.
- パラメータ最適化:EMAサイクルパラメータの選択は,異なる市場と品種に応じて最適化する必要がある.そうでなければ,戦略のパフォーマンスに影響を与える可能性があります.
戦略最適化の方向性
- トレンドフィルタを追加: EMAの交差信号に基づいて,長期トレンド指標 ((EMA50のような) と組み合わせてトレンドフィルタを入れ,偽信号を減らす.
- セットストップ:ATRなどの指標に基づいて動的ストップを設定するか,単一取引の最大損失を制御するために固定パーセントストップを使用する.
- 最適化パラメータ:歴史データへの反省により,EMA周期パラメータを最適化し,現在の市場と品種に最も適したパラメータの組み合わせを見つけます.
- 他の指標と組み合わせる:他の技術指標 (RSI,MACDなど) と組み合わせて,信号の確認度と信頼性を高めるために使用する.
要約する
EMA5とEMA13の交差戦略は,二つの異なる周期EMAの交差によって価格の傾向の変化を捕捉する簡単な使いやすいトレンド追跡戦略である.この戦略の優点は,シンプルで,適応力があり,タイムリーであることにあるが,同時に,偽信号,遅滞性,停止の欠如などのリスクもある.戦略のパフォーマンスをさらに最適化するために,トレンドフィルター,停止の設定,最適化パラメータの追加,および他の技術指標の方法との組み合わせを考慮することができる.実際のアプリケーションでは,特定の市場環境と取引品種に応じて調整と最適化が必要である.
Source
Pine
Strategy parameters
Related strategies
Comment
All comments (0)
No data
- 1