ボリュームヒートマップとリアルタイム価格に基づいた売買戦略

1
Follow
1781
Followers
概要
この戦略は,取引量熱図とリアルタイム価格を組み合わせて,一定期間における価格と取引量分布を分析することによって,買入シグナルを生成する.戦略は,まず,現在の価格と設定された価格範囲のパーセントに基づいて,いくつかの価格レベルを計算する.その後,各価格レベルを過去の一段の期間における買入取引量を統計化し,累積された買入取引量を計算する.累積された買入取引量に基づいて,ラベルの色を決定する.同時に,戦略は,リアルタイム価格曲線を描く.さらに,この戦略は,EMA,VWAPなどの指標を組み合わせて,価格と取引量との関係に基づいて,買入シグナルを生成する.購入条件が満たされ,それ以前にシグナルが生成されなければ,買入シグナルが生成される.
戦略原則
- 現在の価格と設定された価格範囲のパーセントに基づいて,いくつかの価格レベルが計算されます.
- 各価格レベルの過去期間における取引量を統計し,累積取引量を計算する.
- 累積された取引量に基づいて,ラベルの色を決定し,ラベルの表示またはグラフィックを描きます.
- リアルタイム価格曲線を描画する.
- EMA,VWAPなどの指標を計算する.
- 価格とEMA,VWAPなどの指標の関係と取引量条件に基づいて,購入条件が満たされているかどうかを判断する.もし満たされ,以前にシグナルが生じていない場合は,購入シグナルが生じます.
- 価格とEMAなどの指標の関係と取引量条件に基づいて,売却条件を満たすかどうかを判断する.満たされ,以前に信号が生じていない場合は,売却信号が生じます.連続した2つの陰線が,以前に信号が生じていない場合でも,売却信号が生じます.
- 現在の取引条件の状態を記録し,信号生成の状態を更新します.
優位分析
- 取引量ヒートグラフとリアルタイム価格を組み合わせて,価格と取引量分布を直視的に表示し,取引決定に参考を提供する.
- EMA,VWAPなどの指標を導入し,戦略の条件判断を豊かにし,戦略の信頼性を高めました.
- 価格,指数,取引量などの様々な要素を考慮して,買い物シグナルをより包括的かつ堅牢にします.
- 信号生成の制限条件を設定し,連続して重複信号を生成する状況を回避し,誤導的な信号を減らす.
リスク分析
- 戦略のパフォーマンスは,価格範囲のパーセント,回帰期などのパラメータ設定によって影響され,状況に応じて調整および最適化が必要である.
- EMA,VWAPなどの指標は,それ自体にも遅滞や限界があり,特定の市場環境で有効性が失われる可能性があります.
- この戦略は,傾向が強い市場には適用され,波動的な市場では偽信号が多く発生する可能性がある.
- 戦略のリスクコントロールは比較的シンプルで,ストップ・ロスやポジション管理などのリスク管理手段は欠けている.
最適化の方向
- RSI,MACD,ブリン帯など,より多くの技術指標と市場情緒指標を導入し,戦略的な判断の根拠を豊かにする.
- 買い売りシグナルの生成条件を最適化し,シグナルの正確性と信頼性を向上させる.複数の時間枠の分析を導入し,トレンドの方向を確認することを考慮することができる.
- リスク管理手段の追加,例えば,ストップ・ロズとポジション管理,合理的なストップ・ロズとポジションの規模を設定し,単一取引のリスクの<unk>値を制御する.
- 戦略のパラメータ最適化と反テストを行い,最適のパラメータ組み合わせと市場適用範囲を特定する.
- この戦略を他の戦略と組み合わせて,異なる戦略の優位性を発揮し,全体的な安定性と収益性を向上させることを検討する.
要約する
この戦略は,取引量熱図,リアルタイム価格および複数の技術指標を組み合わせて,買取信号を生成し,一定の参照価値を有する.戦略の優点は,価格と取引量の分布を直視的に表示することができ,複数の要因を総合的に考慮してシグナルを生成することにある.しかし,戦略には,パラメータ設定の影響,指標の遅れ,トレンド性市場の依存など,いくつかの制限とリスクがある.したがって,実際のアプリケーションでは,より多くの指標,シグナル条件の最適化,リスク制御の強化などの戦略の安定性と収益性の向上のために,さらなる最適化と戦略の完善が必要である.
Source
Pine
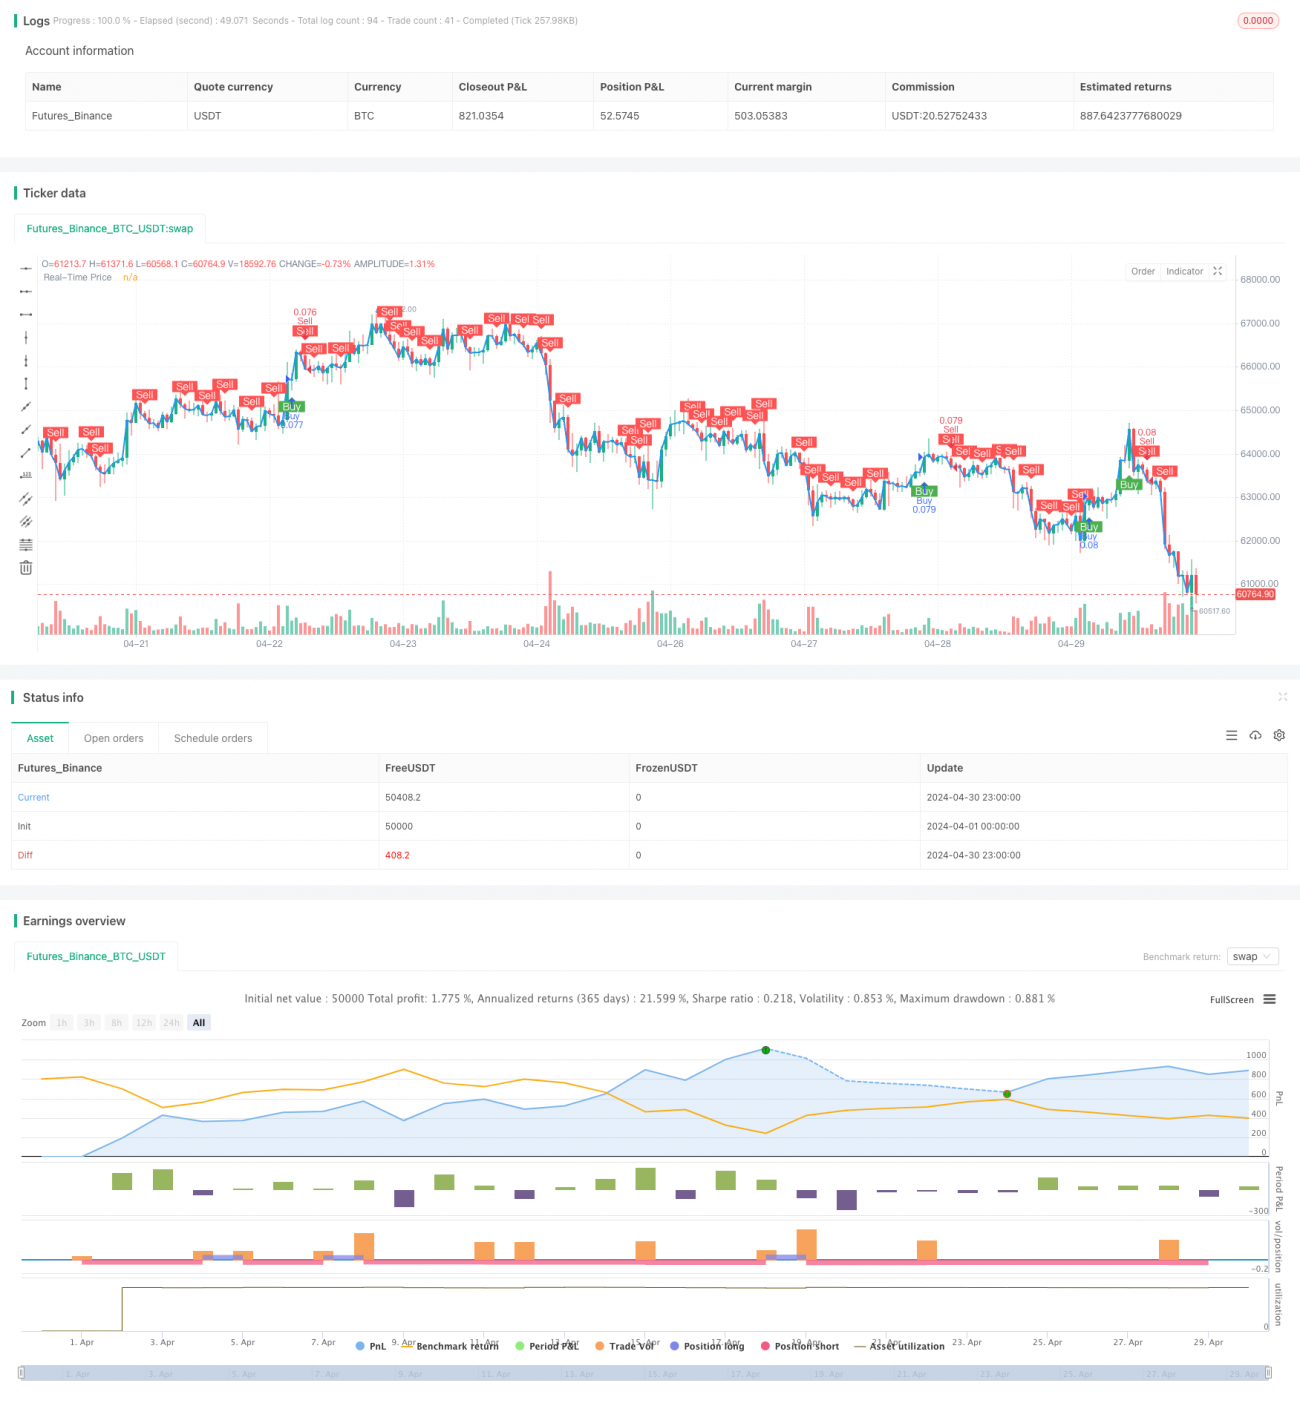
/*backtest
start: 2024-04-01 00:00:00
end: 2024-04-30 23:59:59
period: 1h
basePeriod: 15m
exchanges: [{"eid":"Futures_Binance","currency":"BTC_USDT"}]
*/

//@version=5
strategy("Buy and Sell Volume Heatmap with Real-Time Price Strategy", overlay=true, default_qty_type=strategy.percent_of_equity, default_qty_value=10)

// Settings for Volume HeatmapStrategy parameters
Related strategies
Comment
All comments (0)
No data
- 1