ボリンジャーバンドRSI取引戦略

1
Follow
1781
Followers
概要
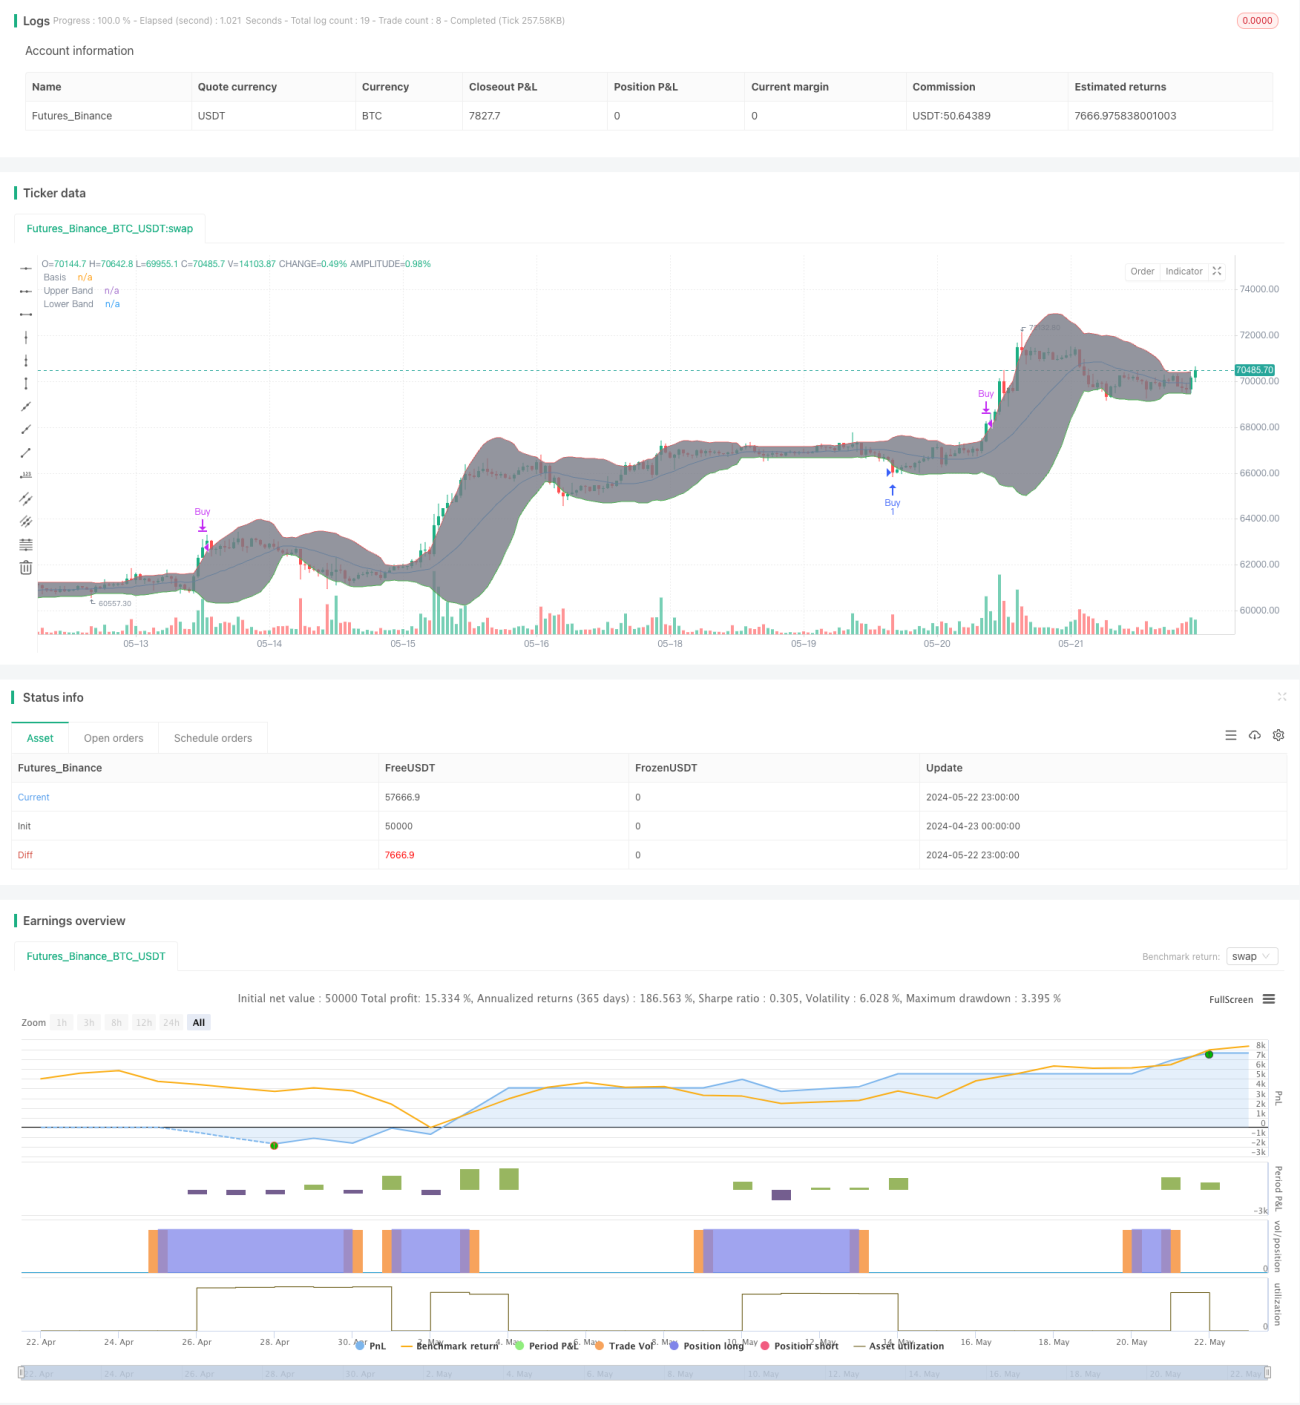
この戦略は,ブリン帯 (Bollinger Bands) と相対的に強い指標 (RSI) を用いて取引信号を識別する.価格がブリン帯を突破して軌道上または下,同時にRSIがオーバーバイレベルより高くまたはオーバーセールレベルより低い場合に,買入または出荷信号を生成する.この戦略は,価格の極端な変動を捕捉し,RSIを使用してトレンドの強さを確認する.
戦略原則
- ブリン帯の上線,中線,下線を計算する。上線と下線は,それぞれ中線加減標準差の倍数である。
- RSIは,価格の過買と過売を測る指標である.
- 閉盘価格がブリン帯下落線以下で,RSIが超売りレベルを下回ると,買入シグナルが生成されます.
- 閉盘価格がブリン帯上位とRSIが超買値より高いとき,売り信号が生じる.
- 買い物や売り出しを行い,逆のシグナルが出た時に平仓する.
戦略的優位性
- 価格とボリュームの指標を組み合わせることで,取引シグナルの信頼性が向上します.
- ブリン・バンドは,市場の変動に合わせて動的に調整できる.
- RSIはトレンドの強さを確認し,横断市場で過剰な取引信号を回避します.
- 戦略の論理は明確で,実行や最適化も簡単です.
戦略リスク
- この戦略は,トレンドがはっきりしない場合や,市場の波動が小さい場合,偽信号を多く発生させる可能性があります.
- RSIとブリン帯のパラメータ選択は,戦略のパフォーマンスに重要な影響を及ぼし,不適切なパラメータは,戦略の不良パフォーマンスを引き起こす可能性があります.
- この戦略は取引コストと滑り点を考慮せず,実際の適用では戦略の収益に影響を及ぼす可能性がある.
戦略最適化の方向性
- ブリン帯のパラメータ (例えば長さと標準差の倍数) とRSIのパラメータ (例えば長さと超買/超売の<unk>値) を最適化することで,戦略の適応性と安定性を向上させる.
- トレンド確認指標や取引量指標などの他の技術指標やフィルター条件を導入して,取引信号の質をさらに向上させる.
- 取引コストと滑り点を考慮し,リスクを制御し,戦略の実際の収益を高めるために合理的なストップとストップを設定します.
- 戦略を反省し,パラメータを最適化し,異なる市場環境でテストし,戦略の安定性を評価する.
要約する
ブリン帯RSI取引戦略は,価格と動力の指標を組み合わせて,価格が極端に変動するときに取引信号を生成する.この戦略の優点は,論理的に明確で,実行しやすく,最適化である.しかし,戦略の性能はパラメータ選択に依存し,特定の市場環境下で偽信号を多く発生させる可能性があります.パラメータを最適化し,他の指標を導入し,実際の取引コストを考慮するなどの方法を使用して,戦略の安定性と収益の可能性をさらに向上させることができます.
Source
Pine
Strategy parameters
Related strategies
Comment
All comments (0)
No data
- 1