QQEインジケーターとRSIインジケーターに基づくロングおよびショートシグナル戦略

1
Follow
1785
Followers
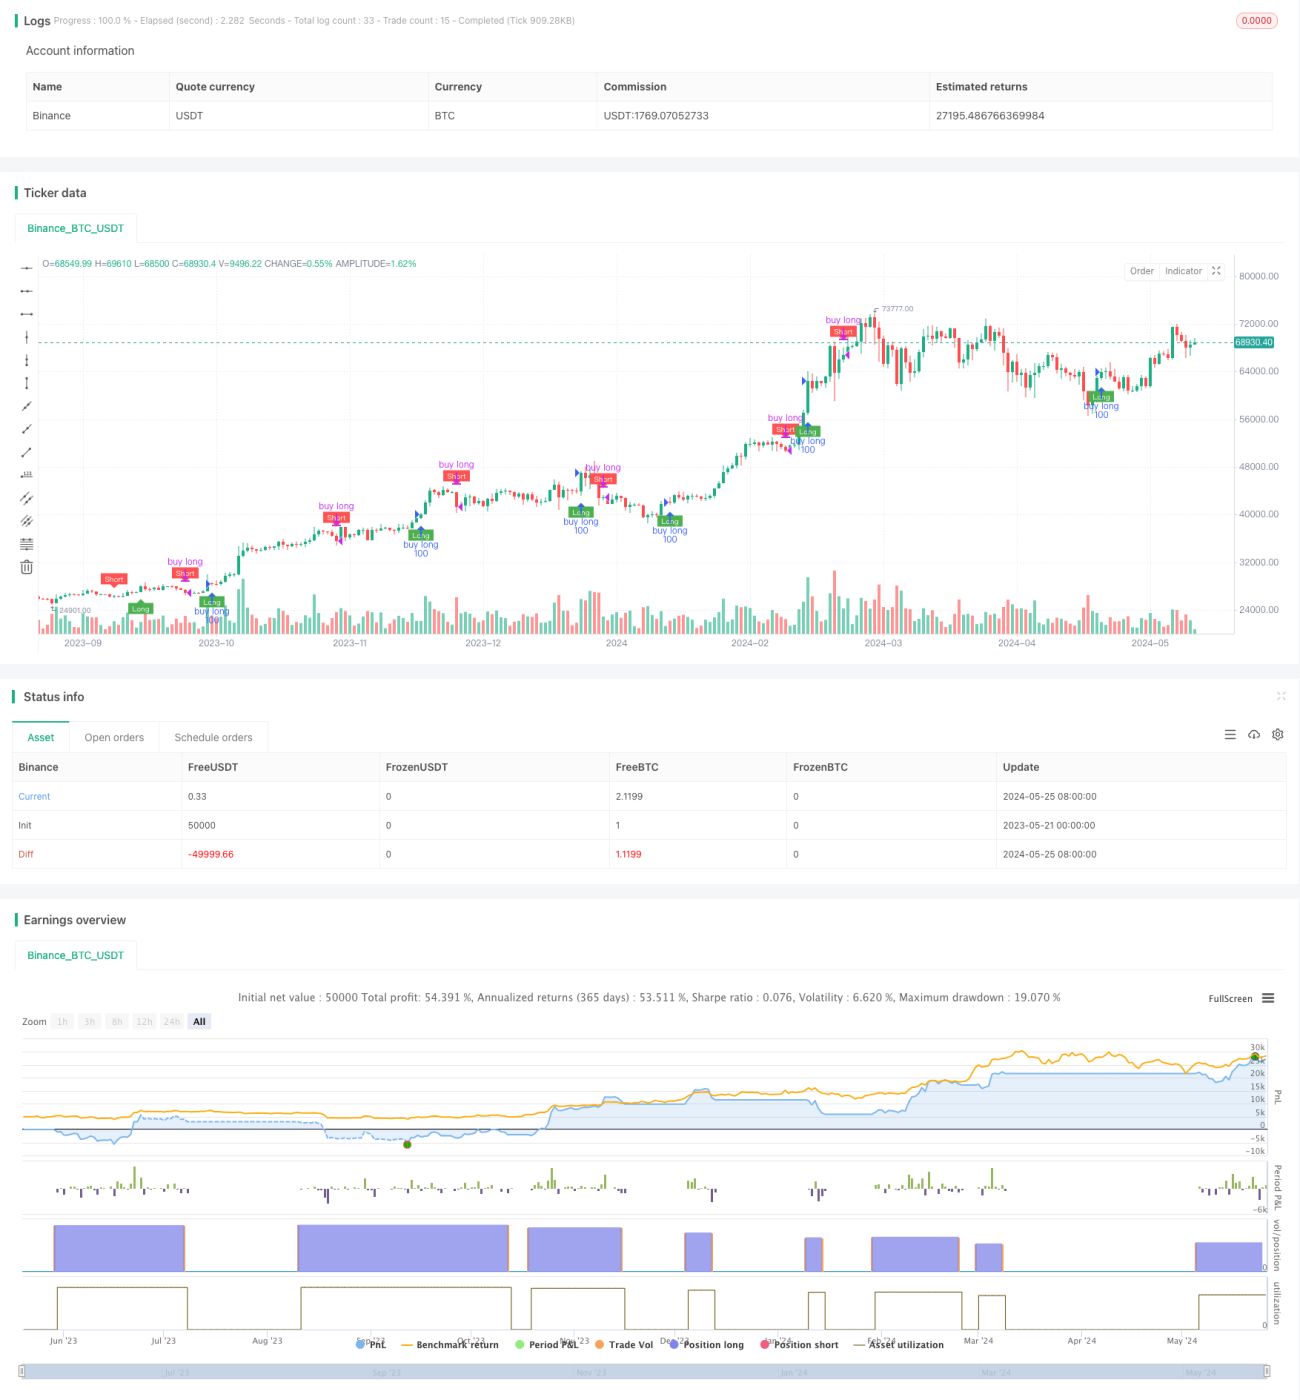
概要
この戦略は,QQE指標とRSI指標をベースに,RSI指標の平滑移動平均値と動的振動幅を計算して多空信号区間を構築する.RSI指標が上位突破時に多空信号を生じ,下位突破時に空き信号を生じする.戦略の主な考え方は,RSI指標のトレンド特性とQQE指標の波動特性を利用して,市場のトレンドの変化と波動の機会を捉えることである.
戦略原則
- RSI指標の平滑移動平均RsiMaを計算し,トレンドの判断の基礎として使う.
- RSI指標の絶対偏差値AtrRsiを計算し,波動を判断するための基礎として,その滑らかな移動平均値MaAtrRsiを計算する.
- QQE因子に基づいて動的振動幅darを計算し,RsiMaと結合して,多空信号区間のlongbandとshortbandを構成する.
- RSI指数と多空信号区間の関係を判断する.RSI指数上はロングバンドを通るときに多空信号が発生し,下はショートバンドを通るときに多空信号が発生する.
- 多空の信号に基づいて取引し,多空の信号が触発されたときにポジションを開き,購入し,空の信号が触発されたときに平仓する.
戦略的優位性
- RSIとQQEの特徴を組み合わせて,市場動向と波動の機会をよりよく捉えることができます.
- ダイナミックな振動幅を用いて信号区間を構築し,市場の変動率の変化に自律的に適応します.
- RSI指数と波動幅の平滑な処理により,騒音の干渉と頻繁な取引を効果的に減らす.
- 論理が明確で,パラメータが少ないので,さらなる最適化や改善に適しています.
戦略リスク
- この戦略は,波動の少ない市場や揺れが強い市場では,理想的な結果を出さない可能性があります.
- 市場が急に逆転した場合には,撤回リスクが大きくなる可能性がある.
- パラメータの設定は戦略の性能に大きく影響し,異なる市場と品種に応じて調整する必要がある.
戦略最適化の方向性
- 撤回リスクを制御するために,固定パーセンテージ・ストップ,ATR・ストップなどの明確なストップメカニズムを導入する.
- パラメータ設定を最適化して,遺伝的アルゴリズム,格子検索などの方法によって最適なパラメータ組み合わせを検索する.
- 取引量,保有量などの他の指標を導入することを検討し,取引信号を豊かにし,戦略の安定性を向上させる.
- 震動市場では,範囲取引または波段操作の論理を導入し,戦略の適応性を強化することを考えることができます.
要約する
この戦略は,RSI指標とQQE指標に基づいて多空信号を構築し,トレンドキャプチャと波動把握の特性を有する.戦略の論理は明確で,パラメータは少ないので,さらなる最適化と改善を行うには適している.しかし,戦略には,撤回制御,パラメータ設定などのいくつかのリスクがあり,さらなる改善が必要である.将来,戦略の安定性と収益性を高めるために,ストップメカニズム,パラメータ最適化,シグナル豊かさ,異なる市場の適応などの面で戦略を最適化することができる.
Source
Pine
Strategy parameters
Related strategies
Comment
All comments (0)
No data
- 1