1
フォロー
1750
フォロワー
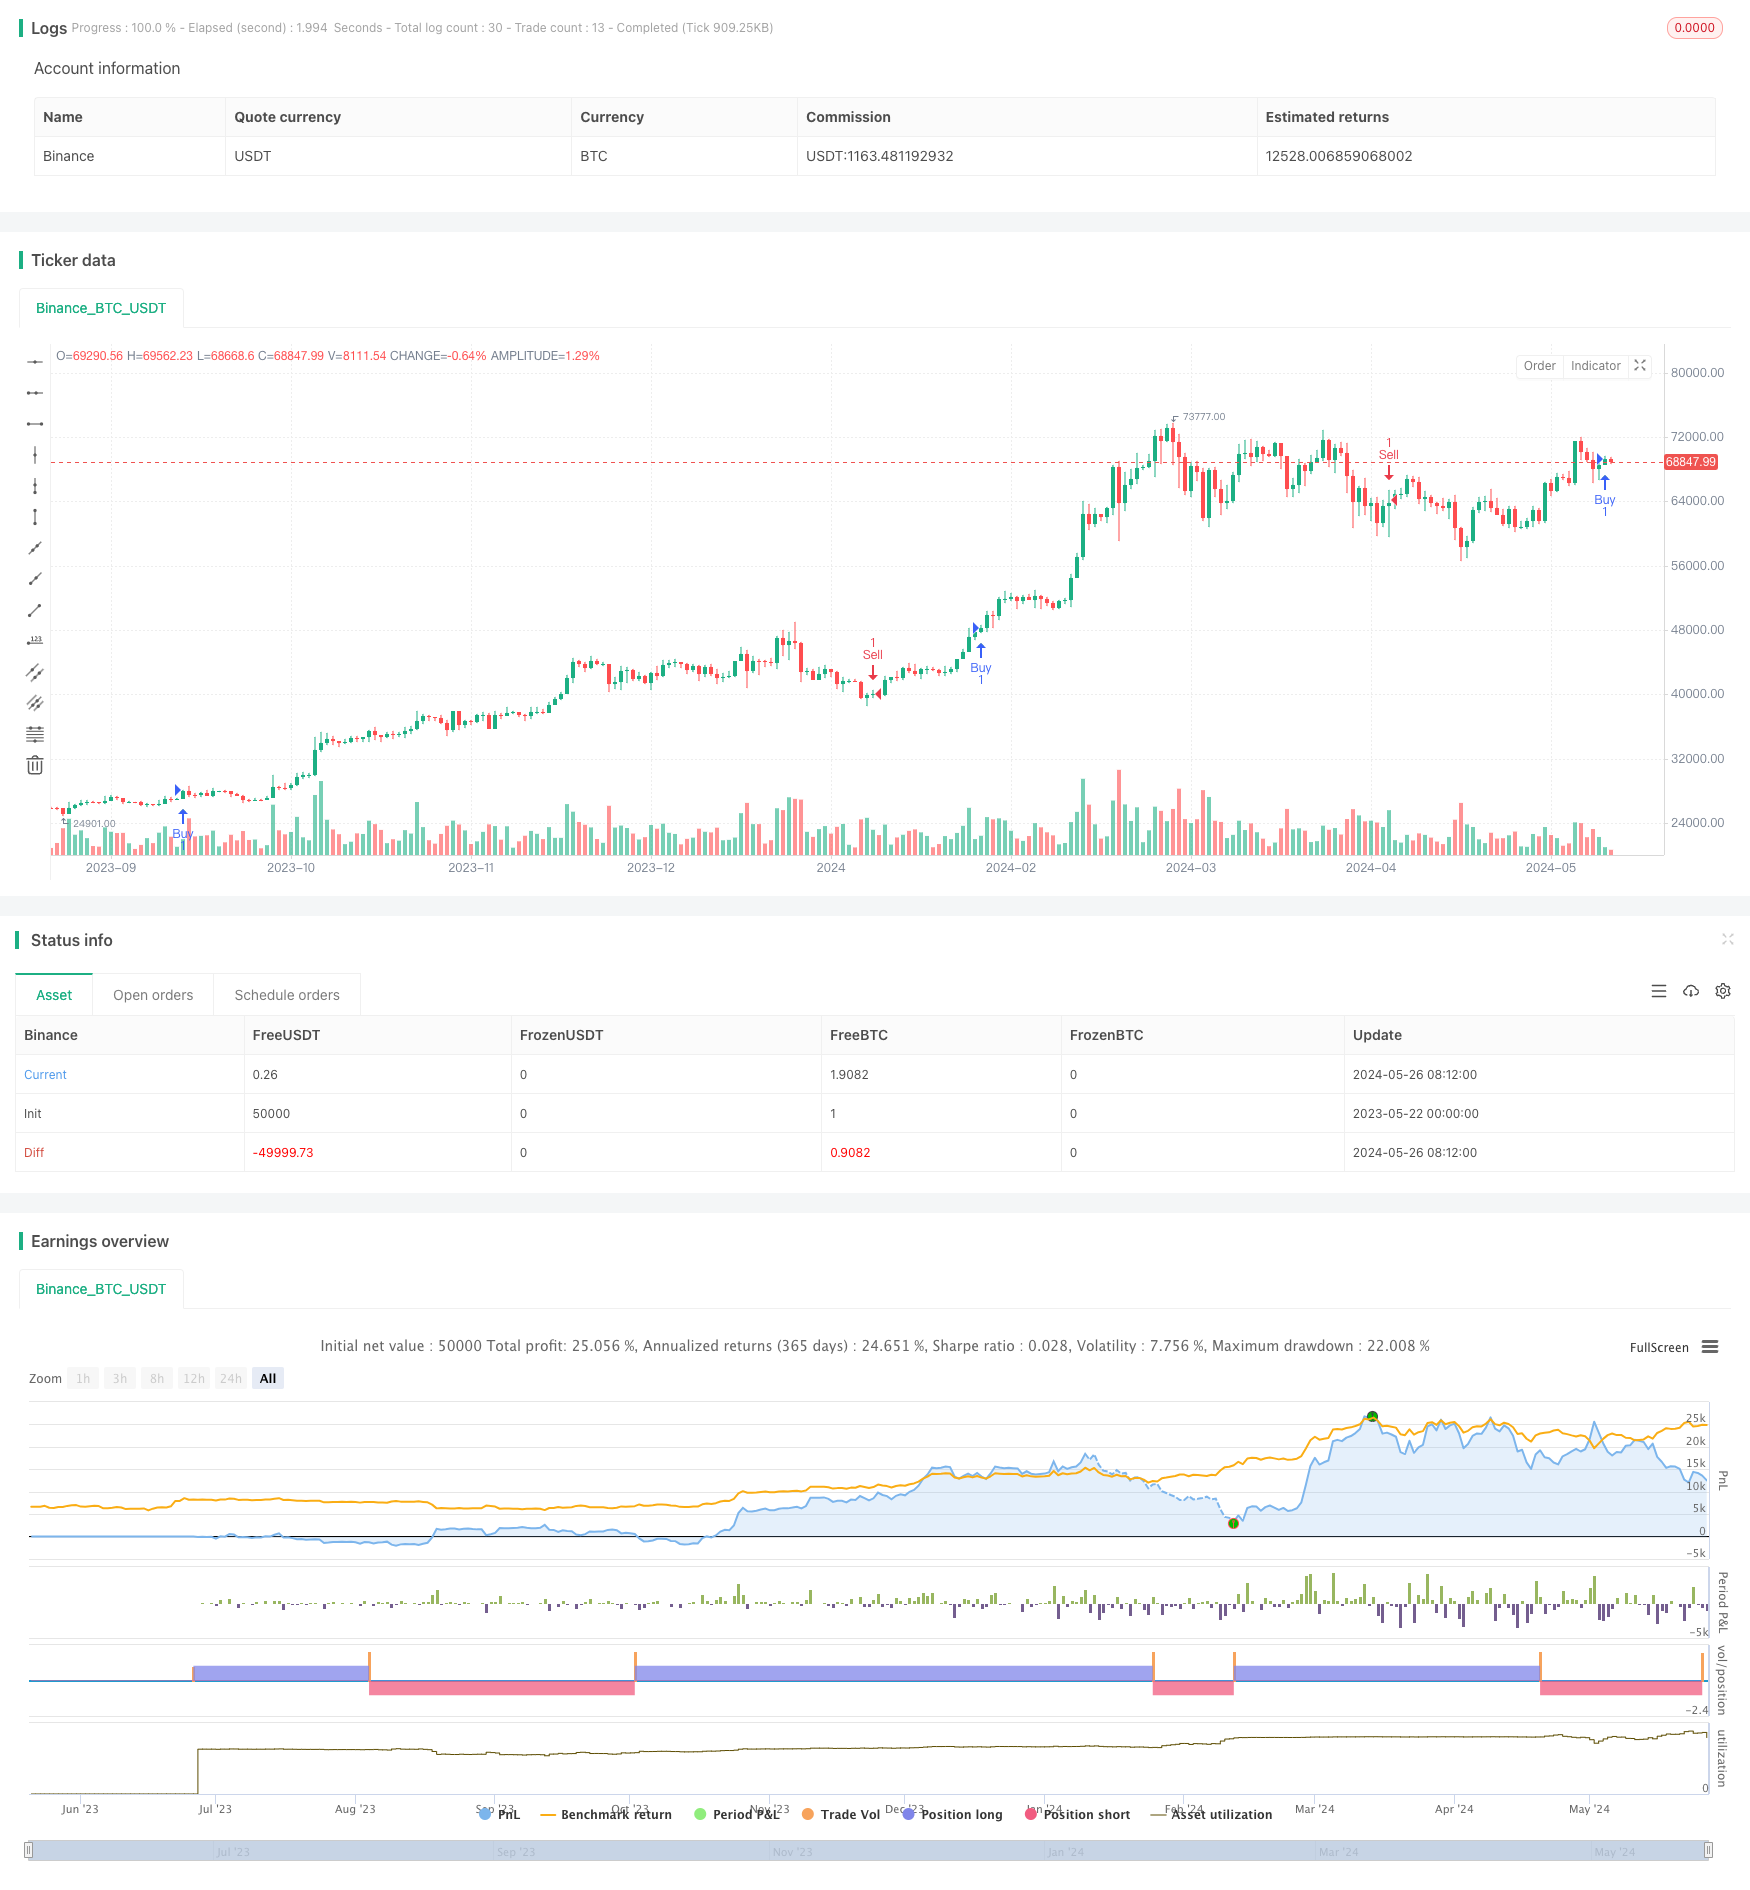
概要
この戦略は,2つの異なる周期の移動平均 ((MA) を使用して取引信号を生成する.短期MAが下から上へと長期MAを横切ると,買入信号を生成する.短期MAが上から下へと長期MAを横切ると,売出信号を生成する.この戦略の主な考え方は,MAのトレンド追跡特性を利用して,MAの交差によってトレンドの転換を捕捉し,取引を行うことである.
戦略原則
- 2つの異なる周期の移動平均 ((MA) を計算し,一つは短期MAであり,もう一つは長期MAである.
- 短期MAが長期MAを下から上へと突破すると,上昇傾向が形成され,買入シグナルが生じる.
- 短期MAが長期MAを上から下へと突破すると,下向きのトレンドが形成され,セールシグナルが生じる.
- 買入と売却のシグナルに基づいて取引し,買入シグナルが出現すると多ポジションを開き,売出シグナルが出現すると空ポジションを開きます.
戦略的優位性
- シンプルで分かりやすい: 戦略の論理は明確で,理解し,実行しやすい.
- トレンド・トラッキング:MA交差でトレンドの変化を捉え,異なる市場動向にうまく適応する.
- パラメータの柔軟性:戦略のパフォーマンスを最適化するために,異なる市場と時間周期に応じて,短期および長期MAの周期パラメータを調整できます.
戦略リスク
- 振動市場:振動市場では,頻繁なMA交差が多くの偽信号を引き起こす可能性があり,その結果,より多くの損益取引が生じます.
- トレンド遅延:MAは遅滞の指標であるため,トレンド転換の初期に,この戦略は利益の一部を逃す可能性があります.
- パラメータ最適化: パラメータの異なる設定は,戦略のパフォーマンスに大きく影響し,パラメータ最適化には,大量の歴史データと計算リソースが必要です.
戦略最適化の方向性
- トレンドフィルタを追加:MA交差が信号を生成した後,偽の信号をフィルタリングするために,他のトレンド指標 (MACD,DMIなど) で二次確認を行うことができます.
- ストップ・ストップ・損失の最適化: 合理的なストップ・ストップ・損失の設定により,トレンドが遅れた場合,損失を最小限に抑え,利潤を走らせることができる.
- 動的パラメータ最適化:異なる市場状況に応じて,MA周期パラメータを動的に調整し,現在の市場特性に適合させる.
- 他のシグナルと組み合わせる:MA交差シグナルを他の技術指標 (RSI,ブリン帯など) と組み合わせ,より信頼性の高い取引シグナルを形成する.
要約する
双均線交差策略は,2つの異なる周期MAの交差によってトレンドの転換を捉える簡単な使いやすいトレンド追跡策策である.この戦略の優点は,論理的に明確で,信号が明確で,トレンド市場に適用される.しかし,揺れ動いている市場で,この戦略は,偽の信号と損失の取引を多く生み出す可能性があります.したがって,実際のアプリケーションでは,トレンドフィルタリング,ストップ・ストップ・損失の最適化,動向参数最適化,および他のシグナルとの組み合わせなどの方法で戦略のパフォーマンスを改善し,その適応性と安定性を向上させることができます.
ストラテジーソースコード
/*backtest
start: 2023-05-22 00:00:00
end: 2024-05-27 00:00:00
period: 1d
basePeriod: 1h
exchanges: [{"eid":"Binance","currency":"BTC_USDT"}]
*/

//@version=5
strategy("Combined Strategy", overlay=true)

// Moving Averages Length Inputs
short_length = input.int(20, "Short MA Length")
long_length = input.int(50, "Long MA Length")

// Moving Averages
ma_short = ta.sma(close, short_length)
ma_long = ta.sma(close, long_length)

// Buy Condition (Moving Average Crossover)
buy_condition = ta.crossover(ma_short, ma_long)
plotshape(series=buy_condition, style=shape.triangleup, location=location.belowbar, color=color.green, size=size.small)

// Sell Condition (Moving Average Crossover)
sell_condition = ta.crossunder(ma_short, ma_long)
plotshape(series=sell_condition, style=shape.triangledown, location=location.abovebar, color=color.red, size=size.small)

// Strategy Entry and Exit
if (buy_condition)
    strategy.entry("Buy", strategy.long)

if (sell_condition)
    strategy.entry("Sell", strategy.short)

// Debug statements
if (buy_condition)
    label.new(x=bar_index, y=low, text="Buy Signal", color=color.green, style=label.style_label_up)

if (sell_condition)
    label.new(x=bar_index, y=high, text="Sell Signal", color=color.red, style=label.style_label_down)