1
フォロー
1750
フォロワー
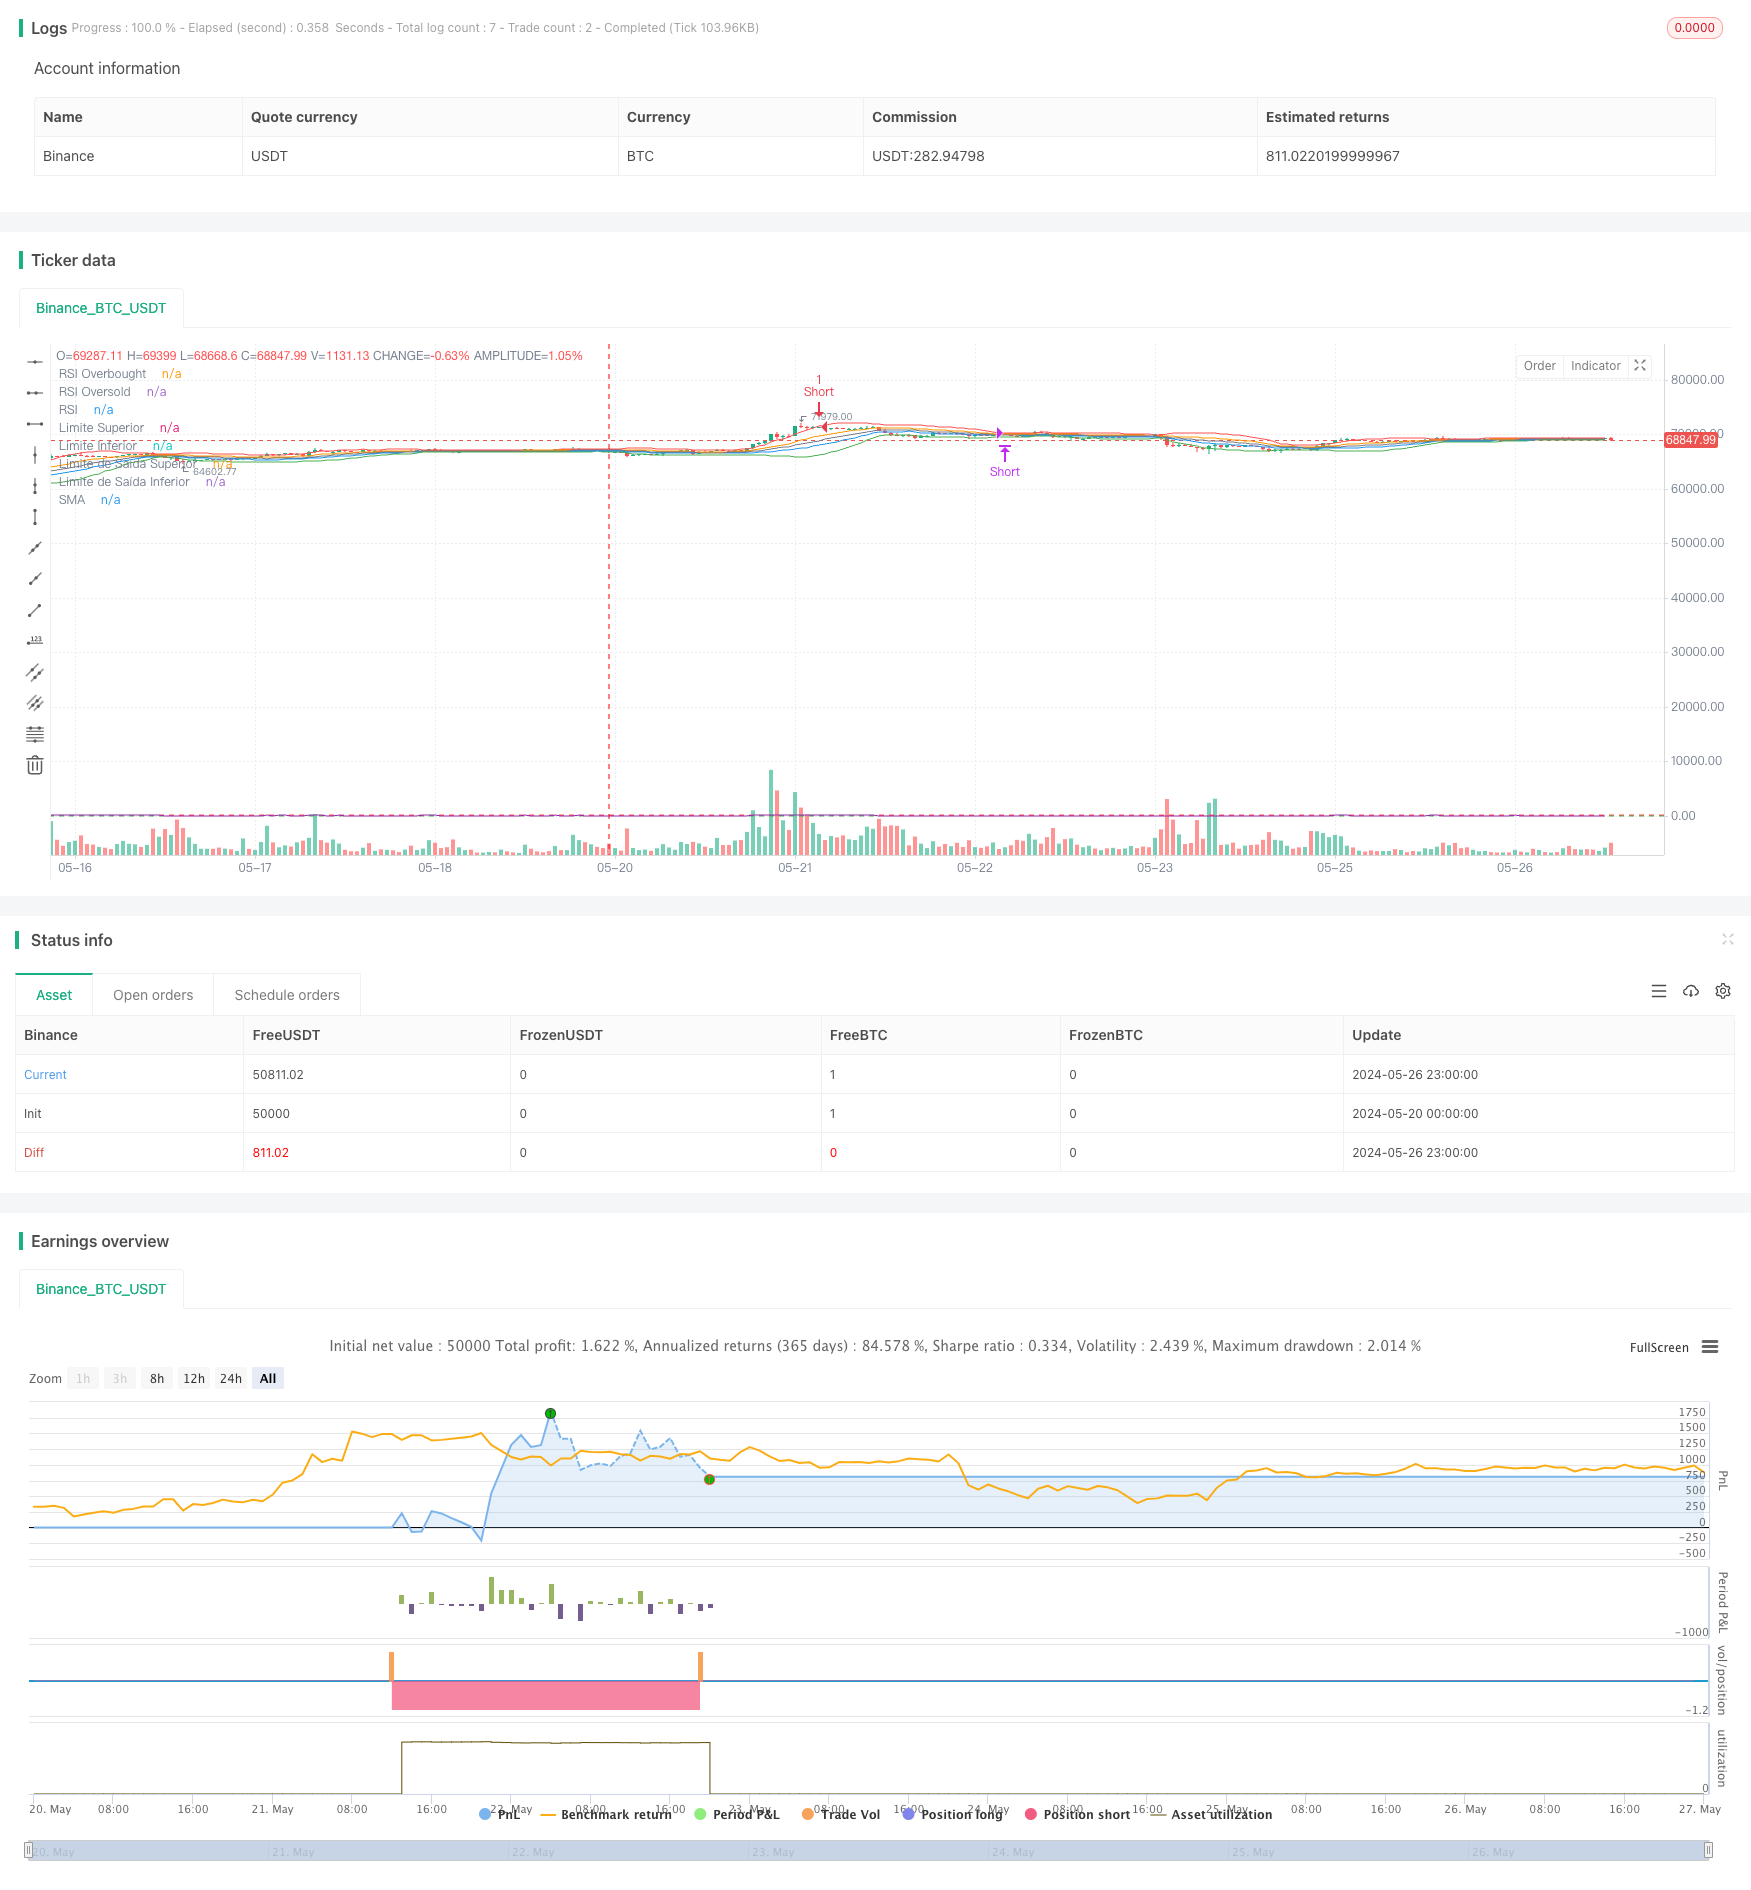
概要
このピンスクリプト戦略は,比較的強い指数であるRSIと価格の変動率の標準差DEVに基づいて,価格と上下軌道を比較して入場点を判断し,RSIを補助的なフィルタリング指標として使用し,価格が上下軌道に触れ,RSIが超買超売区間に達すると,開場シグナルを生じ,価格が逆転して脱出軌道に突入すると,またはRSIが逆転して超買超売区間に達すると,平仓する.この戦略は,市場の変動状況に応じて動的に調整し,波動率が高くても損失を止めて,波動率が低くてもポジションを保持し,異なる市場状態に適応できる量化取引戦略である.
戦略原則
- 価格を計算すると,過去6期間の移動平均SMAと標準差DEVである.
- 中枢軸はSMA+thresholdEntry*DEVは,SMA-thresholdEntryで軌道に乗っている.*DEVは下線で,波動率通路を構築する.
- RSI指数は,過去rsiLength周期の閉盘価格を計算する.
- 価格が下落を突破し,RSIが超売り値rsiOversoldより小さいとき,オーバーストーリングシグナルが生成されます.
- 価格が下方軌道に突破し,RSIが超買値rsiOverboughtより大きいとき,空きポジションシグナルが発生する.
- 中枢軸はSMA+thresholdExit*DEVは上線して,SMA-thresholdExit*DEVは下線で,別の狭い脱出通路を構築した.
- オーバーポジションを保持する際,価格が下方突破して下落するか,RSIが超買い値より大きい場合は,オーバーポジションを平にする.
- 空白のポジションを保持する際,価格が上方突破して軌道外出するか,RSIが超売り値より小さい場合,空白のポジション.
優位分析
- 価格行動と動態指標の補助判断を用いて,偽信号を効果的にフィルターすることができます.
- 波動率を動的に調整することで,戦略が異なる市場状況に適応できるようにチャネル幅を調整します.
- 2つのチャネルを設定し,価格の逆転の初期に損失を止め,引き下げを制御し,トレンドが形成された後にポジションを保持して利益を得る.
- コードロジックとパラメータ設定が明確で,理解し,最適化することが簡単です.
リスク分析
- 市場が一方的なトレンドを継続すると,この戦略は早めにストップしてトレンドの利潤を逃す可能性があります.
- パラメータ設定は戦略のパフォーマンスに大きく影響し,異なる品種と周期に対してそれぞれパラメータ最適化が必要である.
- 戦略は,振動市場において優位であり,トレンド市場では一般的である.長期のトレンドが突然逆転した場合,この戦略は,より大きな引き下がりを生み出す可能性がある.
- 固定パラメータ設定は,標識の資産変動率が急激に変化した場合,無効になる可能性があります.
最適化の方向
- 長期短期平均線交差,ADXなどのトレンド判断指標を導入し,トレンドと振動市場を区別し,異なるパラメータ設定を使用することができます.
- ATRのような,より適応性の高い波動率指標を使用することを検討し,波動率チャネル幅の動的調整を行う.
- ポジション開設前に価格動向のトレンド判断を行い,明瞭なトレンドにあるかどうかを検出し,逆転取引を避ける.
- 遺伝的アルゴリズム,格子検索などの方法によって,異なるパラメータの組み合わせを最適化して,最適なパラメータ設定を探することができる.
- 多頭と空頭ポジションのそれぞれに異なるパラメータ設定を使用して,リスクの口を制御することを検討する.
要約する
この戦略は,波動率チャネルと比較的強いインデックスを組み合わせた方法で,価格の変動と同時にRSI指標を参考にして平仓判断を行うことで,段階的なトレンドを把握し,タイムリーで止損と利益の結末が得られます.しかし,戦略のパフォーマンスはパラメータ設定に比較的敏感であり,異なる市場環境と標識の資産に最適化する必要があり,同時に,他の指標を導入することを考慮します.
ストラテジーソースコード
/*backtest
start: 2024-05-20 00:00:00
end: 2024-05-27 00:00:00
period: 1h
basePeriod: 15m
exchanges: [{"eid":"Binance","currency":"BTC_USDT"}]
*/

// This Pine Script™ code is subject to the terms of the Mozilla Public License 2.0 at https://mozilla.org/MPL/2.0/
// © tmalvao

//@version=5
strategy("Estratégia de Desvio Padrão com RSI", overlay=true, margin_long=100, margin_short=100)

// Parâmetros
length = input.int(20, title="Período do Desvio Padrão")
thresholdEntry = input.float(1.5, title="Limite de Entrada")
thresholdExit = input.float(0.5, title="Limite de Saída")
rsiLength = input.int(14, title="Período do RSI")
rsiOverbought = input.int(70, title="RSI Overbought")
rsiOversold = input.int(30, title="RSI Oversold")

// Cálculo do Desvio Padrão
price = close
stdDev = ta.stdev(price, length)

// Média Móvel Simples
sma = ta.sma(price, length)

// Limites baseados no Desvio Padrão
upperLimit = sma + thresholdEntry * stdDev
lowerLimit = sma - thresholdEntry * stdDev
exitUpperLimit = sma + thresholdExit * stdDev
exitLowerLimit = sma - thresholdExit * stdDev

// Cálculo do RSI
rsi = ta.rsi(price, rsiLength)

// Condições de Entrada com RSI
longCondition = ta.crossover(price, lowerLimit) and rsi < rsiOversold
shortCondition = ta.crossunder(price, upperLimit) and rsi > rsiOverbought

// Condições de Saída com RSI
exitLongCondition = ta.crossunder(price, exitLowerLimit) or rsi > rsiOverbought
exitShortCondition = ta.crossover(price, exitUpperLimit) or rsi < rsiOversold

// Plotar Linhas
plot(upperLimit, color=color.red, title="Limite Superior")
plot(lowerLimit, color=color.green, title="Limite Inferior")
plot(exitUpperLimit, color=color.orange, title="Limite de Saída Superior")
plot(exitLowerLimit, color=color.blue, title="Limite de Saída Inferior")
plot(sma, color=color.gray, title="SMA")
hline(rsiOverbought, "RSI Overbought", color=color.red)
hline(rsiOversold, "RSI Oversold", color=color.green)
plot(rsi, title="RSI", color=color.purple)

// Estratégia de Trade
if (longCondition)
    strategy.entry("Long", strategy.long)

if (shortCondition)
    strategy.entry("Short", strategy.short)

if (exitLongCondition)
    strategy.close("Long")

if (exitShortCondition)
    strategy.close("Short")