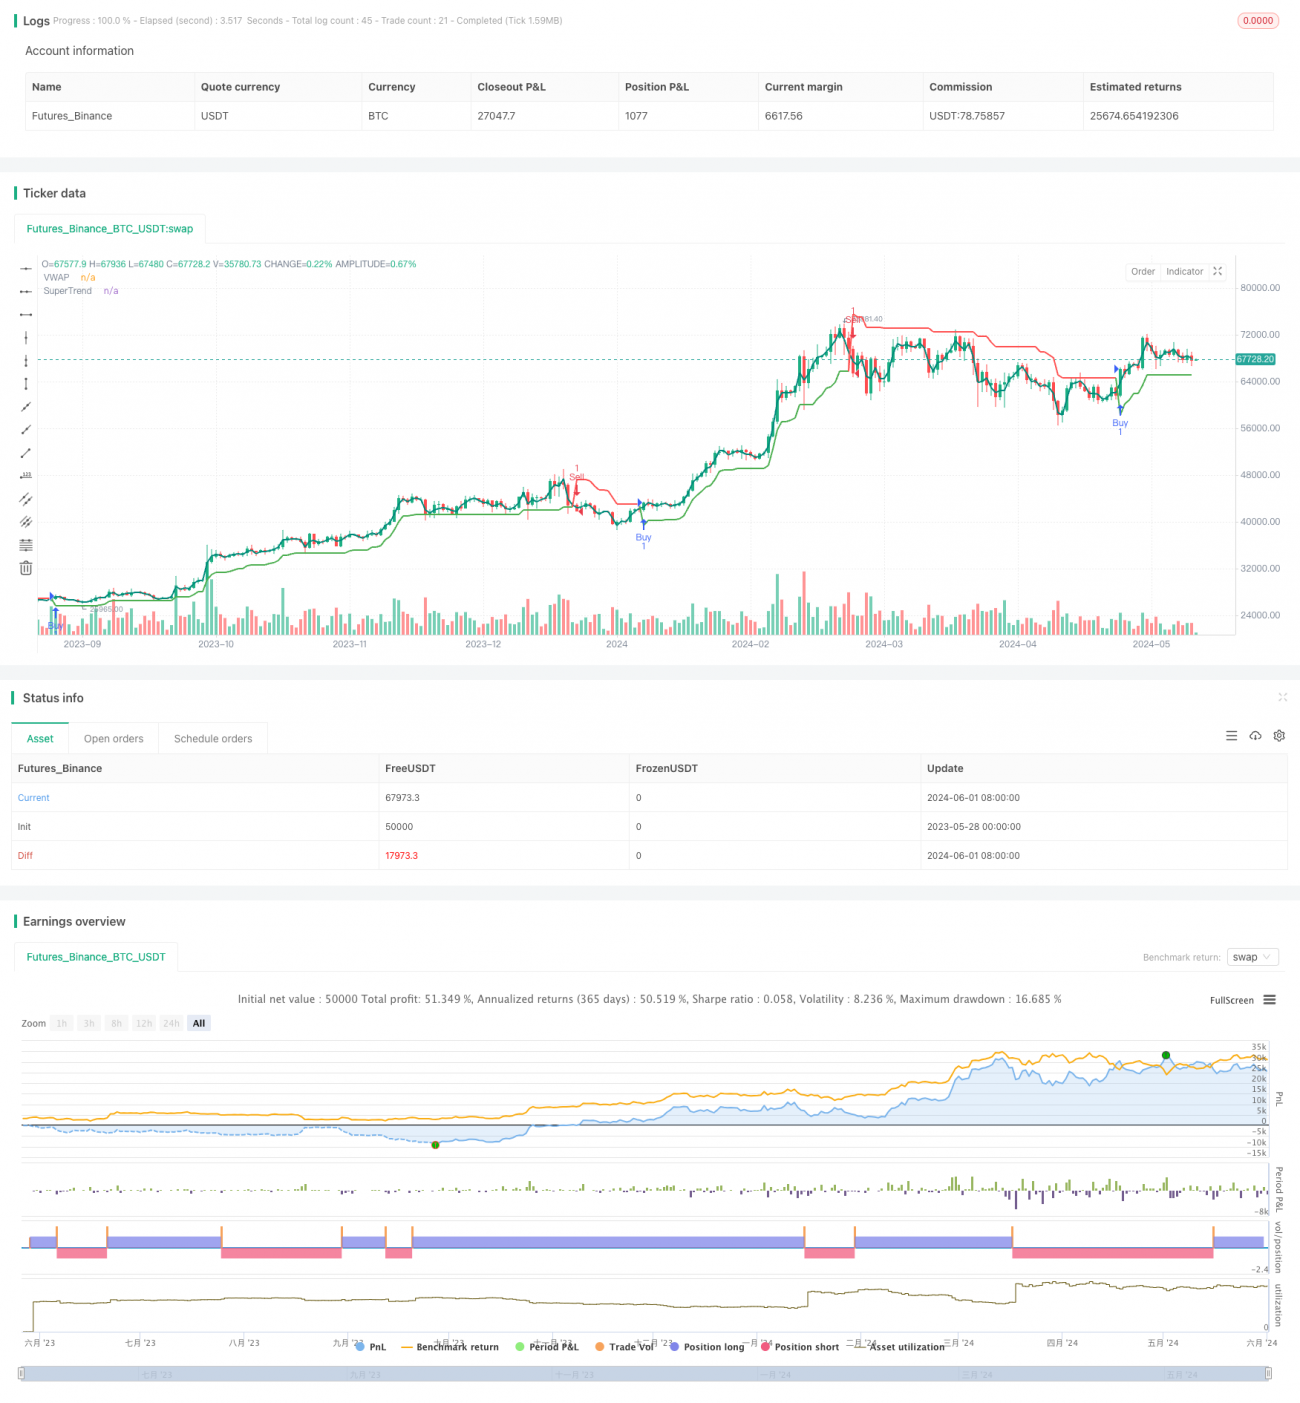
VWAPとスーパートレンドの売買戦略

1
Follow
1781
Followers
概要
この戦略は,VWAP ((成交量加重平均価格) とスーパートレンド指標を組み合わせている.価格とVWAPの相対的な位置,およびスーパートレンド指標の方向を比較して,買入シグナルを判断する.価格がVWAPを上を通過し,スーパートレンドが正であるとき,買入シグナルを生成する.価格がVWAPを下を通過し,スーパートレンドが負であるとき,売出シグナルを生成する.この戦略はまた,前回のシグナル状態を記録し,反方向のシグナルが現れるまで,重複シグナルを回避する.
戦略原則
- VWAPの長さをカスタマイズできるta.vwap関数を使用してVWAP指標を計算します.
- 超トレンド指標を計算するには,ta.supertrend関数を使用し,ATR周期と倍数をカスタマイズすることができます.
- 購入条件:VWAPを現在の価格で購入し,スーパートレンドは正方向である.
- 販売条件の判断:現在の価格を下回ってVWAPを通過し,超トレンドの方向は負である.
- 前回の信号の状態を記録し,連続して同向信号が発生するのを避ける.現在の信号が前回の信号と異なる場合にのみ,新しい取引信号が生成される.
戦略的優位性
- VWAPとスーパートレンドの2つの指標を組み合わせることで,市場動向と潜在的転換点をより全面的に判断できます.
- VWAPの指標は,取引量要因を考慮し,市場の実際の動きをよりよく反映します.
- スーパートレンド指数は,トレンドを追跡し,振動をフィルターすることで,主要なトレンドを捉えるのに役立ちます.
- 信号の重複を避ける仕組みにより,取引の頻度や取引コストを減らすことができます.
戦略リスク
- この戦略は,市場が大きく波動し,トレンドが不明であるときに,偽信号を多く生み出す可能性があります.
- 戦略のパフォーマンスは,VWAPと超トレンドのパラメータの選択に依存し,異なるパラメータ設定は,異なる結果をもたらす可能性があります.
- この戦略は,リスク管理とポジションコントロールを考慮せず,実際の適用では,他の措置と組み合わせてリスクを制御する必要があります.
戦略最適化の方向性
- 傾向確認メカニズム,例えば平均線または他の傾向指標を使用して,信号をさらにフィルタリングするメカニズムを追加します.
- パラメータ選択を最適化し,VWAPの長さ,ATR周期,倍数の組み合わせを,過去データに遡る.
- リスク管理策の導入,例えば,ストップとストップを設定し,単一取引のリスクを制御する.
- 固定比率やケリー公式のような資金管理戦略を入れることを検討し,ポジションの大きさを最適化してください.
要約する
VWAPとスーパートレンドの買取り戦略は,2つの異なるタイプの指標を組み合わせることで,市場動向と潜在的なターニングポイントを全面的に捉えようとする.戦略の論理は明確で,実行しやすく,最適化できる.しかし,この戦略のパフォーマンスはパラメータ選択に依存し,リスク管理の手段が欠如している.実際のアプリケーションでは,異なる市場環境と取引ニーズに対応するために,さらなる最適化と改善が必要である.
Source
Pine
Strategy parameters
Related strategies
Comment
All comments (0)
No data
- 1