
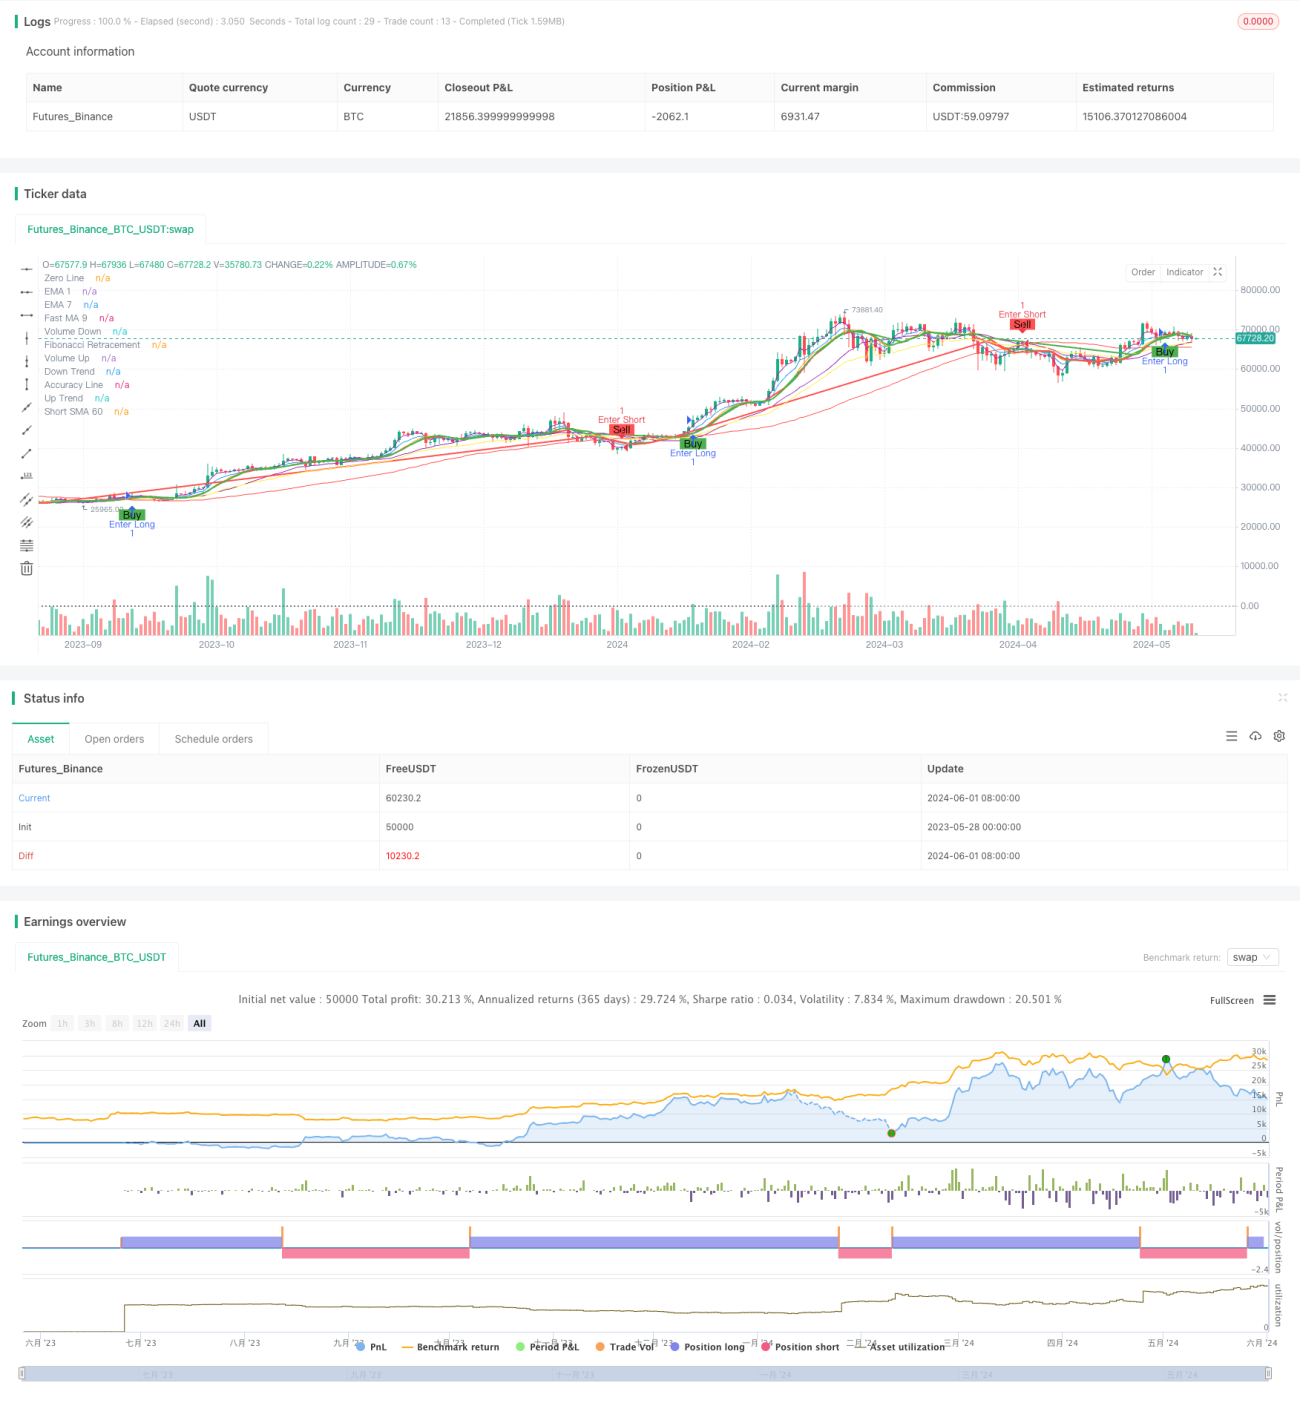
この戦略は,価格と取引量のシグナル,およびフィボナッチ・リトラクション・レベルを組み合わせて,15分と45分の時間枠で買い物シグナルを生成する.この戦略は,シンプル・ムービング・アベアンス (SMA) とインデックス・ムービング・アベアンス (EMA) を含む,複数の移動平均 (MA) をトレンドと動きの指標として使用する.さらに,フィボナッチ・リトラクション・レベルを潜在的なエントリーポイントとして使用する.この戦略の主な目的は,価格と取引量の顕著な変化が起きたときに,買い物と売買の機会をタイムリーに捉えることです.
この戦略は,価格,取引量,フィボナッチ逆転レベルを組み合わせて,複数のタイムフレームで買い買いシグナルを生成する.戦略の優点は,複数の市場要素を総合的に考慮し,複数のMAとEMAを補助指標として使用することです.しかし,戦略は,震動的な市場で過剰な取引シグナルを生成し,歴史的データ計算の指標に依存する可能性があるため,その適応性と信頼性を高めるためにさらなる最適化が必要である.最適化の方向には,トレンド強度指標の導入,パラメータの最適化,他の技術指標の統合,リスク管理措置の導入などが含まれる.
/*backtest
start: 2023-05-28 00:00:00
end: 2024-06-02 00:00:00
period: 1d
basePeriod: 1h
exchanges: [{"eid":"Futures_Binance","currency":"BTC_USDT"}]
*/
//@version=5
strategy(title="Buy/Sell with Volume and Candlestick Signals", overlay=true)
// Fibonacci Retracement Levels
var float[] fibonacciLevels = array.new_float(5)
array.set(fibonacciLevels, 2, 0.47)
array.set(fibonacciLevels, 3, 0.658)
array.set(fibonacciLevels, 4, 0.886)
// Calculate Fibonacci Retracement Levels
fibonacciRetrace(highLevel, lowLevel) =>
priceRange = highLevel - lowLevel
retracementLevels = array.new_float(0)
for i = 0 to array.size(fibonacciLevels) - 1
level = highLevel - array.get(fibonacciLevels, i) * priceRange
array.push(retracementLevels, level)
retracementLevels
fibRetracementValues = fibonacciRetrace(high, low)
fibRetracement = ta.sma(close, 21)
plot(fibRetracement, color=color.purple, title="Fibonacci Retracement")
// Define inputs
fast_ma = input.int(title="Fast MA Period", defval=10)
short_sma_10 = input.int(title="Short SMA 10 Period", defval=10)
short_sma_60 = input.int(title="Short SMA 60 Period", defval=60)
slow_ma = input.int(title="Slow MA Period", defval=30)
ema1Length = input.int(title="EMA 1 Length", defval=3)
fast_ma_9 = input.int(title="Fast MA 9", defval=9)
// Define indicators
fast_ma_val = ta.sma(close, fast_ma)
short_sma_10_val = ta.sma(close, short_sma_10)
short_sma_60_val = ta.sma(close, short_sma_60)
slow_ma_val = ta.sma(close, slow_ma)
up_trend = fast_ma_val > slow_ma_val
down_trend = fast_ma_val < slow_ma_val
volume_up = volume > ta.sma(volume, 20)
volume_down = volume < ta.sma(volume, 20)
// Calculate accuracy values
fast_ema_val = ta.ema(close, fast_ma)
slow_ema_val = ta.ema(close, slow_ma)
ema1_val = ta.ema(close, ema1Length)
fast_ma_9_val = ta.sma(close, fast_ma_9)
ema7_val = ta.ema(close, 7)
accuracy = ta.crossover(close, slow_ma_val) ? fast_ema_val : slow_ema_val
// Define lines
plot(up_trend ? fast_ma_val : na, color=color.green, linewidth=2, title="Up Trend")
plot(down_trend ? fast_ma_val : na, color=color.red, linewidth=2, title="Down Trend")
plot(volume_up ? fast_ma_val : na, color=color.green, linewidth=2, title="Volume Up")
plot(volume_down ? fast_ma_val : na, color=color.red, linewidth=2, title="Volume Down")
plot(accuracy, color=color.yellow, linewidth=1, title="Accuracy Line")
plot(ema1_val, color=color.purple, linewidth=1, title="EMA 1")
plot(fast_ma_9_val, color=color.orange, linewidth=1, title="Fast MA 9")
plot(ema7_val, color=color.blue, linewidth=1, title="EMA 7")
plot(short_sma_60_val, color=color.red, linewidth=1, title="Short SMA 60")
hline(0, color=color.gray, linestyle=hline.style_dotted, title="Zero Line")
// Buy/Sell Signals
buySignal = ta.crossunder(short_sma_60_val, accuracy)
sellSignal = ta.crossover(short_sma_60_val, accuracy)
// Exit Signals
exitLongSignal = ta.crossunder(fast_ma_9_val, ema7_val)
exitShortSignal = ta.crossover(fast_ma_9_val, ema7_val)
// Plot Buy/Sell Signals
plotshape(buySignal, title="Buy Signal", location=location.belowbar, color=color.green, style=shape.labelup, text="Buy")
plotshape(sellSignal, title="Sell Signal", location=location.abovebar, color=color.red, style=shape.labeldown, text="Sell")
if exitLongSignal
strategy.close("Buy")
if exitShortSignal
strategy.close("Sell")
if buySignal
strategy.entry("Enter Long", strategy.long)
else if sellSignal
strategy.entry("Enter Short", strategy.short)