概要
この記事では,MACDとSupertrendの2つの技術指標を組み合わせた取引戦略について説明します. この戦略は,MACD指標の交差信号とSupertrend指標のトレンド方向を使用して,トレンドの状況で利益を得るため,入場と出場のタイミングを判断します. この戦略の主要な考え方は,MACD金叉のSupertrendが緑であるときに多めにすることであり,MACDの交差点とSupertrendが赤であるときに空きをすることであり,MACD信号線とMACD線の交差点は平衡の信号です.
戦略原則
この戦略は,MACD指数とSupertrend指数を使用して取引信号を生成する.MACDは,高速移動平均 ((デフォルト12日) を減算して,遅い移動平均 ((デフォルト26日) を取得し,MACDの9日移動平均を信号線として計算する.MACD線上の信号線を横断すると金叉が形成され,多信号となる;MACD線下を通るときは死叉が形成され,空信号となる.Supertrend指数とATR波動率指数は,価格がSupertrend線より高く,Supertrend線が緑になると上昇傾向を示し,価格がSupertrend線より低く,Supertrend線が赤になると下降傾向を示します.
戦略的優位性
- トレンドと動力の指標を組み合わせると,トレンドの状況をよりよく把握できます. MACD指標は,トレンドの転換を事前に判断する主導権を有し,スーパートレンド指標は,振動的な状況を効果的にフィルターすることができます. 両者は,トレンドの状況の中で適切なタイミングでポジションを構築し,戦略的利益を向上させることができます.
- 信号線交差を平仓の信号として採用し,時効で止損を止める.MACD信号線は,価格の短期的な傾向に反応し,それがMACD線と交差すると,トレンドが逆転する可能性があり,時効で平仓は,より大きな損失を回避するために,効果的に引き戻しを制御できる.
- 策略の論理は明確で,規則はシンプルで,実装・最適化も容易である.この策略は,二つの常用技術指標のみを使用し,計算方法は成熟し,異なるパラメータに基づいて容易に反測・最適化することができる.
戦略リスク
- MACDとSupertrendのパラメータ選択の適性リスク. MACDとSupertrendの指標の計算は,時間周期パラメータを含み,異なる市場と品種の最適パラメータは異なる可能性があり,固定パラメータは,特定の状況下で戦略が失敗する可能性があります.
- トレンド転換の認識遅延のリスク。MACDは,トレンド型指標として,その信号は相対価格に一定の遅延性があり,トレンド転換の初期に依然として誤った信号を発信する可能性があります。そしてSupertrendは,トレンド転換の判断にも一定の遅延があります。
- 振動する市場での頻繁な取引のリスク.この戦略は振動する市場で金叉と死叉の信号が頻繁に発生し,あまりにも頻繁に取引し,高い取引コストを負い,戦略の収益を低下させる可能性があります.
戦略最適化の方向性
- 異なる品種と周期に対してMACDとSupertrendのパラメータを最適化する. 最適なパラメータの組み合わせを探し,戦略の適応性と安定性を高めるために,貧乏策法や遺伝的アルゴリズムなどを使用できる.
- MACD金叉死叉信号の基礎に,取引量変化,価格突破などの他のフィルタリング条件を追加して,トレンド転換をさらに確認し,偽信号を減らす.
- ポジション管理とストップ・ストップ・メカニズム (ATRストップ,パーセンテージストップ・ストップなど) を導入し,単一取引リスクを制御し,戦略の撤回制御能力と損率を向上させる.
- 周期フィルターや品種交代ルールを加え,波動的な市場での取引頻度を減らし,戦略の利回りリスク比率を高めることを検討する.
要約する
この記事では,MACD指数とSupertrend指数に基づく取引戦略を紹介する.この戦略は,MACDのトレンド判断とSupertrendの方向をフィルターすることで,トレンドの状況で取引し,信号ラインの交差を有効に平衡して,撤回を制御する.戦略の優点は,論理の簡素性,トレンド把握能力の強さであり,同時にパラメータの適用性,信号の遅れ,頻繁な取引のリスクがある.将来,パラメータの最適化,信号のフィルター,ポジション管理,周期,品種選択などの側面から戦略を完善することができる.
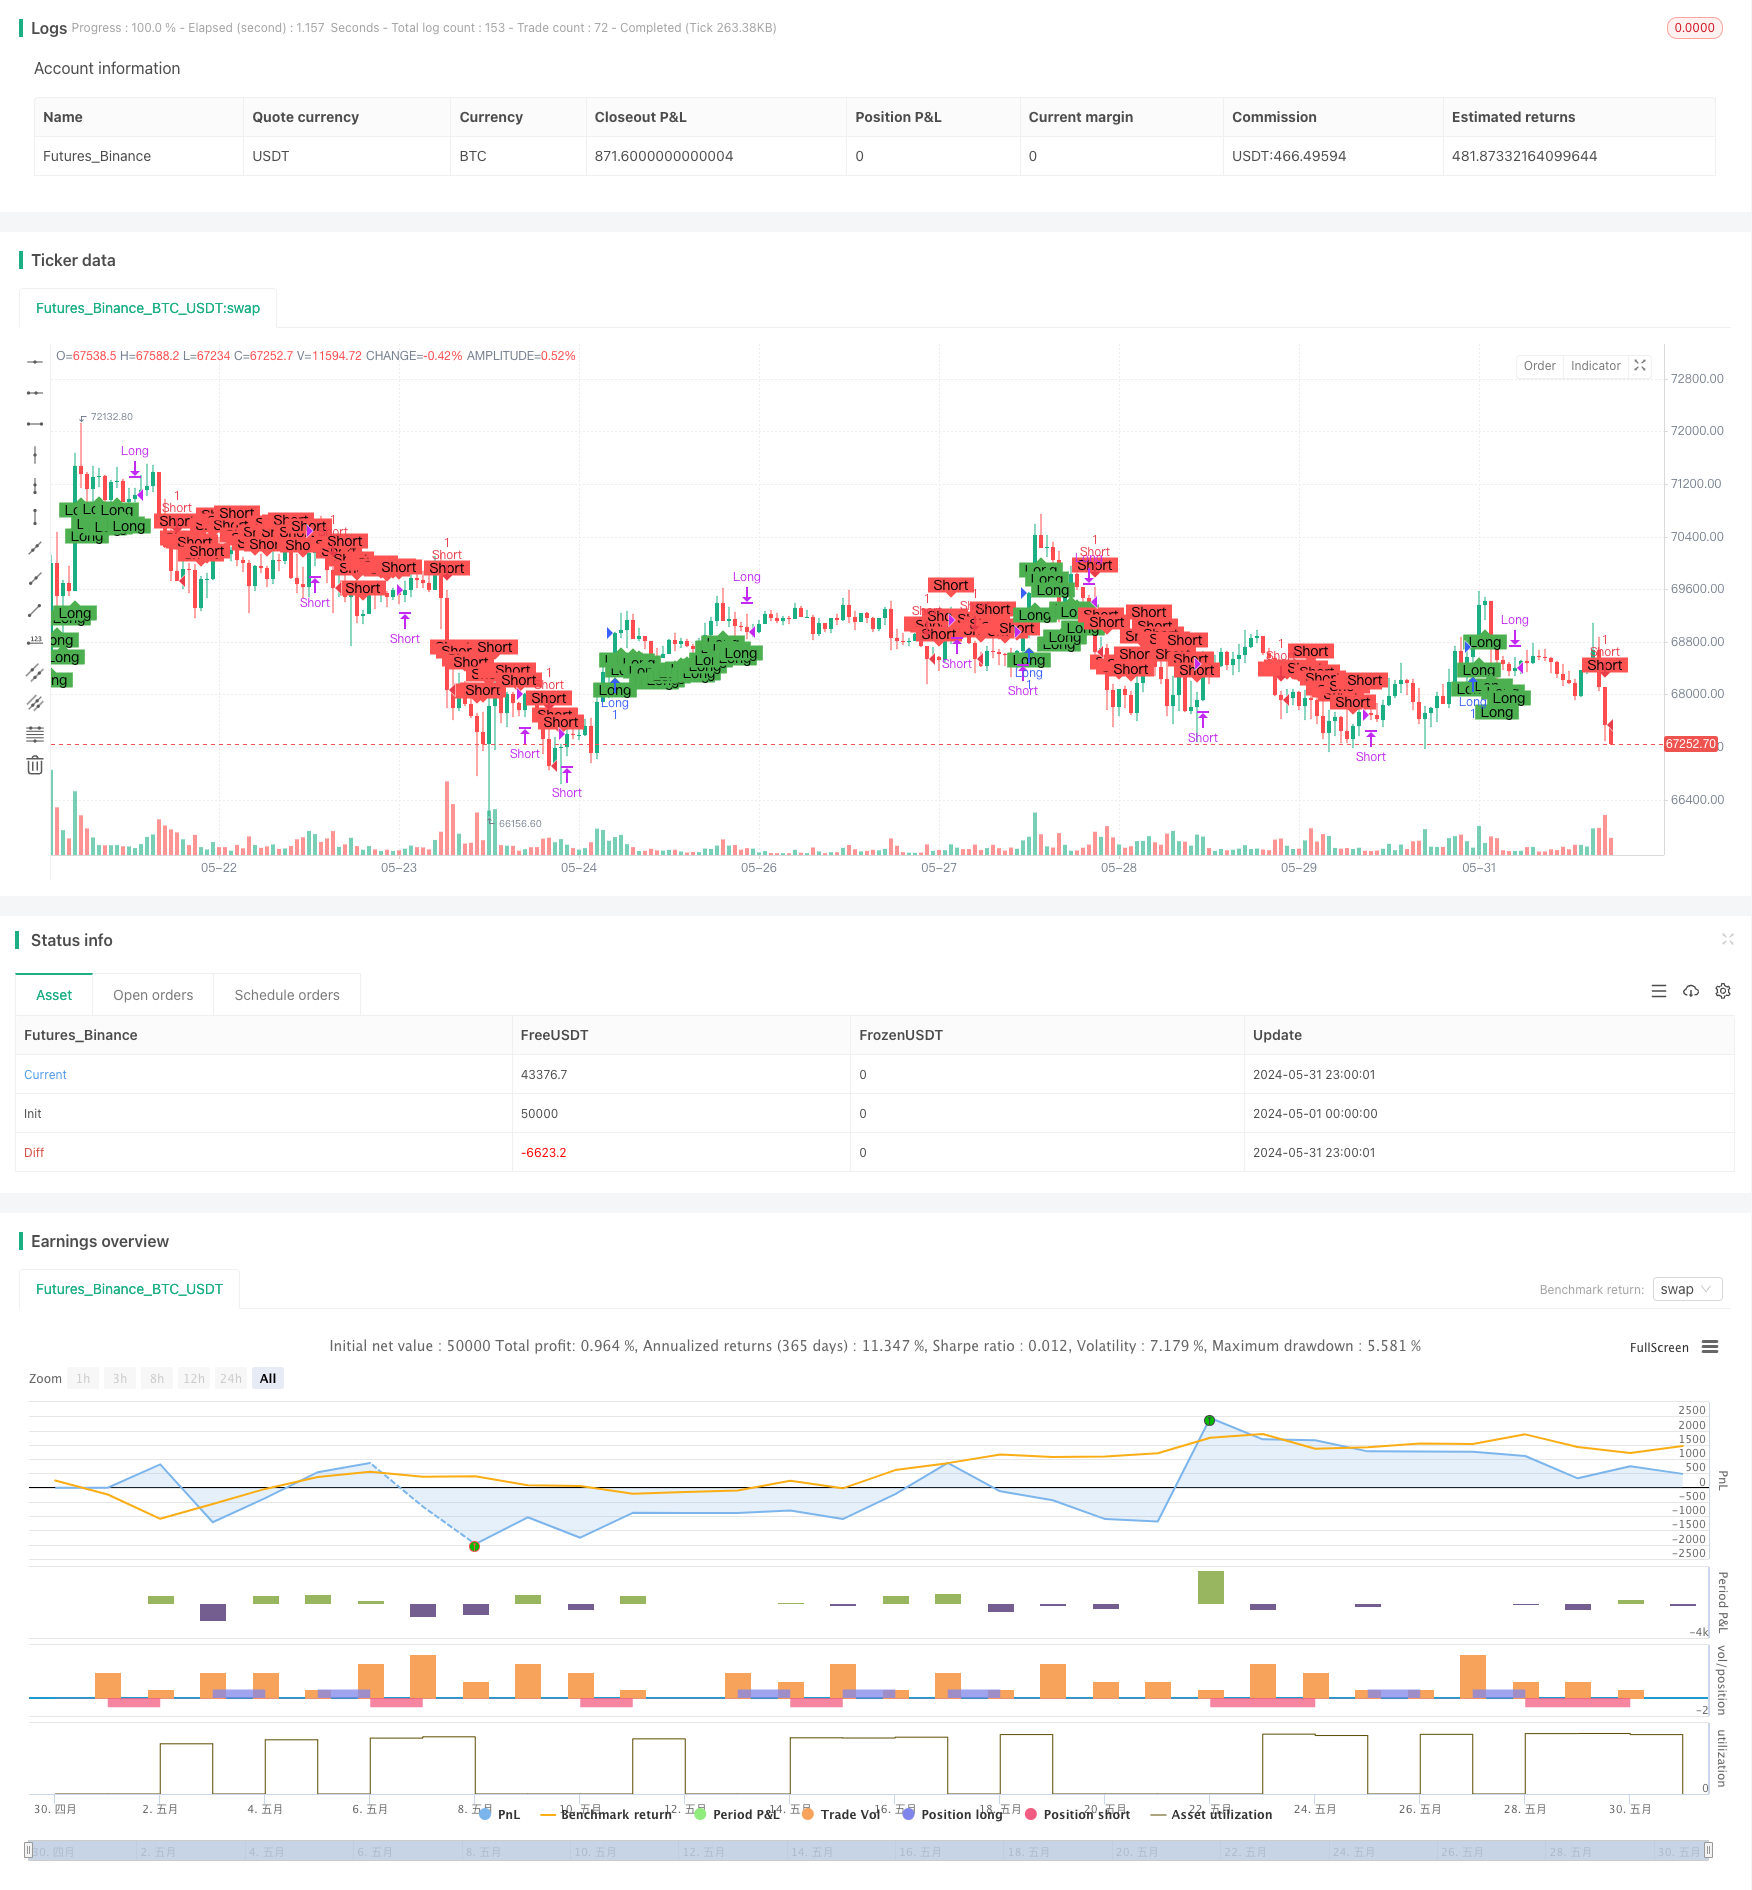
/*backtest
start: 2024-05-01 00:00:00
end: 2024-05-31 23:59:59
period: 1h
basePeriod: 15m
exchanges: [{"eid":"Futures_Binance","currency":"BTC_USDT"}]
*/

//@version=5
strategy(title="MACD + Supertrend Strategy", overlay=true)

// MACD Calculation
fastLength = 12
slowLength = 26
signalSmoothing = 9
macdSrc = close

// MACD Line
fastMA = ta.ema(macdSrc, fastLength)
slowMA = ta.ema(macdSrc, slowLength)
macdLine = fastMA - slowMA

// MACD Signal Line
signalMA = ta.ema(macdLine, signalSmoothing)

// MACD Histogram
histogram = macdLine - signalMA

// Supertrend Calculation
supertrendATRLength = 10
supertrendFactor = 3.0
[supertrend, _] = ta.supertrend(supertrendFactor, supertrendATRLength)

// Entry and Exit Conditions
longCondition = (macdLine > signalMA) and (supertrend < close)
shortCondition = (signalMA > macdLine) and (supertrend > close)

// Long Entry
if longCondition
    strategy.entry("Long", strategy.long)

// Long Exit (Sell)
if signalMA > macdLine
    strategy.close("Long")

// Short Entry
if shortCondition
    strategy.entry("Short", strategy.short)

// Short Exit (Cover)
if macdLine > signalMA
    strategy.close("Short")

// Close Long Position if short condition is met
if shortCondition
    strategy.close("Long")

// Close Short Position if long condition is met
if longCondition
    strategy.close("Short")

// Plotting
plotshape(series=longCondition, title="Long Entry Signal", location=location.belowbar, color=color.green, style=shape.labelup, text="Long")
plotshape(series=shortCondition, title="Short Entry Signal", location=location.abovebar, color=color.red, style=shape.labeldown, text="Short")

// Alerts
alertcondition(longCondition, title='Long Entry Signal', message='MACD crossover and Supertrend below close price')
alertcondition(signalMA > macdLine, title='Long Exit Signal', message='MACD signal line crosses above MACD line')

alertcondition(shortCondition, title='Short Entry Signal', message='MACD crossunder and Supertrend above close price')
alertcondition(macdLine > signalMA, title='Short Exit Signal', message='MACD line crosses above MACD signal line')