パーセンテージ閾値定量取引戦略

1
Follow
1781
Followers
概要
この記事では,パーセントの<unk>値に基づく量的な取引戦略について説明します. この戦略は,パーセントの<unk>値を設定し,適切な時間周期を選択することで,買入と売却のタイミングを決定します. 価格が前回の閉盘価格に比べて上昇または下落し,指定されたパーセントの<unk>値を超えると,買入または売却のシグナルが誘発されます. この戦略は,ユーザーのリスク好みと市場状況に応じて柔軟に調整され,様々な金融商品の取引に適用されます.
戦略原則
この戦略の核心は,価格の変化のパーセントに基づいて取引シグナルを生成することです. まず,ユーザーは,価格が前の閉店価格に比べて変化の幅を表すパーセントの値下げを設定する必要があります. また,ユーザーは,その時間帯の最高価格,最低価格,閉店価格を計算するために,1分,1時間,1日などの時間周期を選択する必要があります. この戦略は,市場価格をリアルタイムで監視し,現在の時間周期の最高価格が前の閉店価格を上回ると,値下げが加わると,買入シグナルが誘発されます.
戦略的優位性
- シンプルで使いやすい:この戦略は,パーセンテージの値下げとタイムサイクルという2つのパラメータを設定するだけで,取引信号を自動的に生成し,操作が簡単である.
- 柔軟性: ユーザは,リスクの好みや市場特性を考慮して,異なる取引環境に対応するために,パーセントの値下げと時間周期を調整できます.
- 適用範囲:この戦略は,株,期貨,外貨などの様々な金融機関に適用され,価格データがある限り取引が可能である.
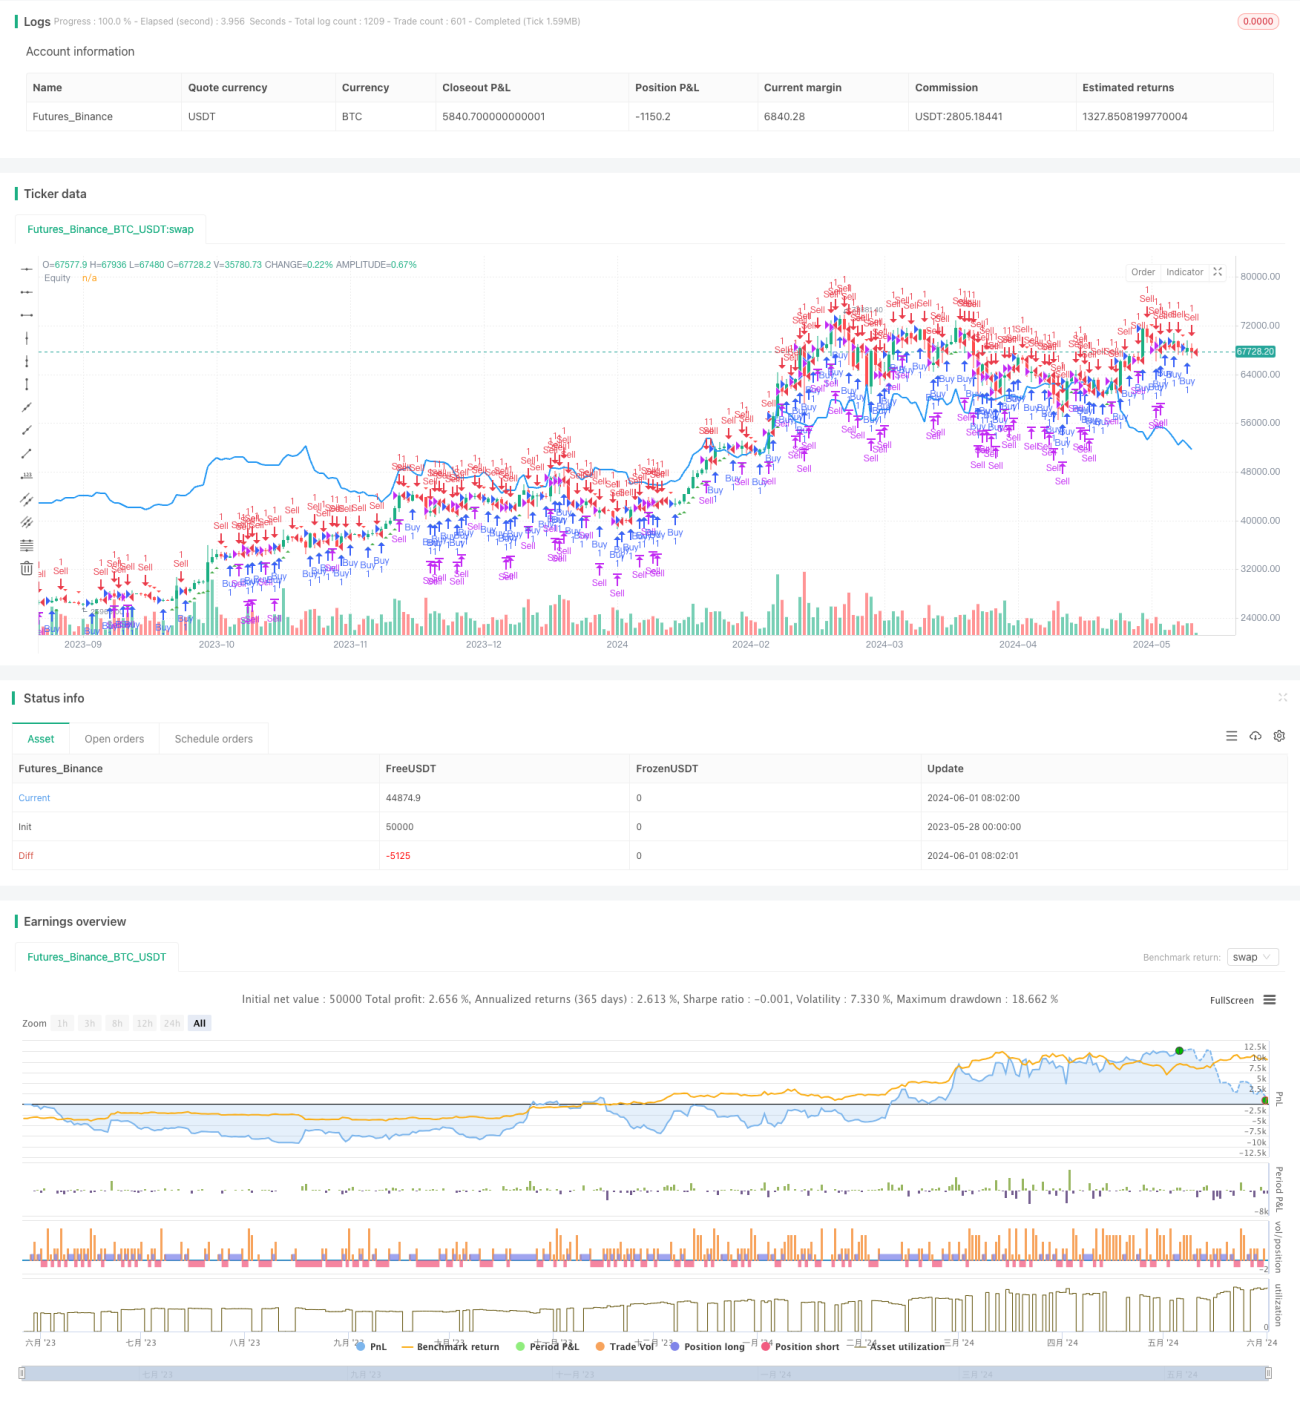
- 直観的: 戦略はチャートに直接買い売り信号を表示し,資金曲線を描画し,トレーダーが戦略のパフォーマンスを直観的に評価できるようにする.
戦略リスク
- 市場の変動リスク:市場の価格が激しく波動するときに,頻繁に取引することは,戦略の収益に影響する取引コストと滑り点を引き起こす可能性があります.
- パラメータ設定のリスク:不適切なパーセントの値下げと時間周期の設定は,戦略の不良なパフォーマンスを引き起こす可能性があるため,市場の特徴と個人の経験に応じて調整する必要がある.
- 過度適合リスク:戦略のパラメータが過度に最適化されれば,将来の市場環境で戦略の不良なパフォーマンスを引き起こす可能性があり,十分な反省と前向きな分析が必要である.
戦略最適化の方向性
- ストップ・アンド・ストップ・メカニズムの追加: リスク管理のため,ストップ・アンド・ストップの機能を戦略に追加し,価格が既定のストップ・アンド・ストップ価格に達したときに自動的にポジションを平らげ,資金の安全性を保護する.
- ダイナミック調整パラメータ:市場の変動に応じて,変化する市場状況に対応するために,パーセントの値下げと時間周期を動的に調整できます.例えば,市場の変動が激化すると,取引頻度を減らすために値下げを適切に上昇させることができます.
- 他の技術指標と組み合わせる: 戦略を他の技術指標 (移動平均,相対的に強い指標など) と組み合わせ,より安定した取引システムを形成し,戦略の信頼性を向上させる.
要約する
この記事では,パーセントの<unk>値に基づく量化取引戦略を紹介し,価格の変化のパーセントの<unk>値と時間周期を設定することで,自動的に買入と売却の信号を生成する.この戦略は操作が簡単で,柔軟性があり,適用範囲は広いが,同時に市場波動,パラメータ設定および過適合などのリスクにも直面する.ストップ・ストップ・メカニズム,パラメータの動的な調整,および他の技術指標と組み合わせる方法を追加することで,この戦略のパフォーマンスをさらに最適化し,実際の取引における効果を高めることができる.
Source
Pine
Strategy parameters
Related strategies
Comment
All comments (0)
No data
- 1