ダイナミックタイムフレームハイローブレイクアウト戦略

1
Follow
1781
Followers
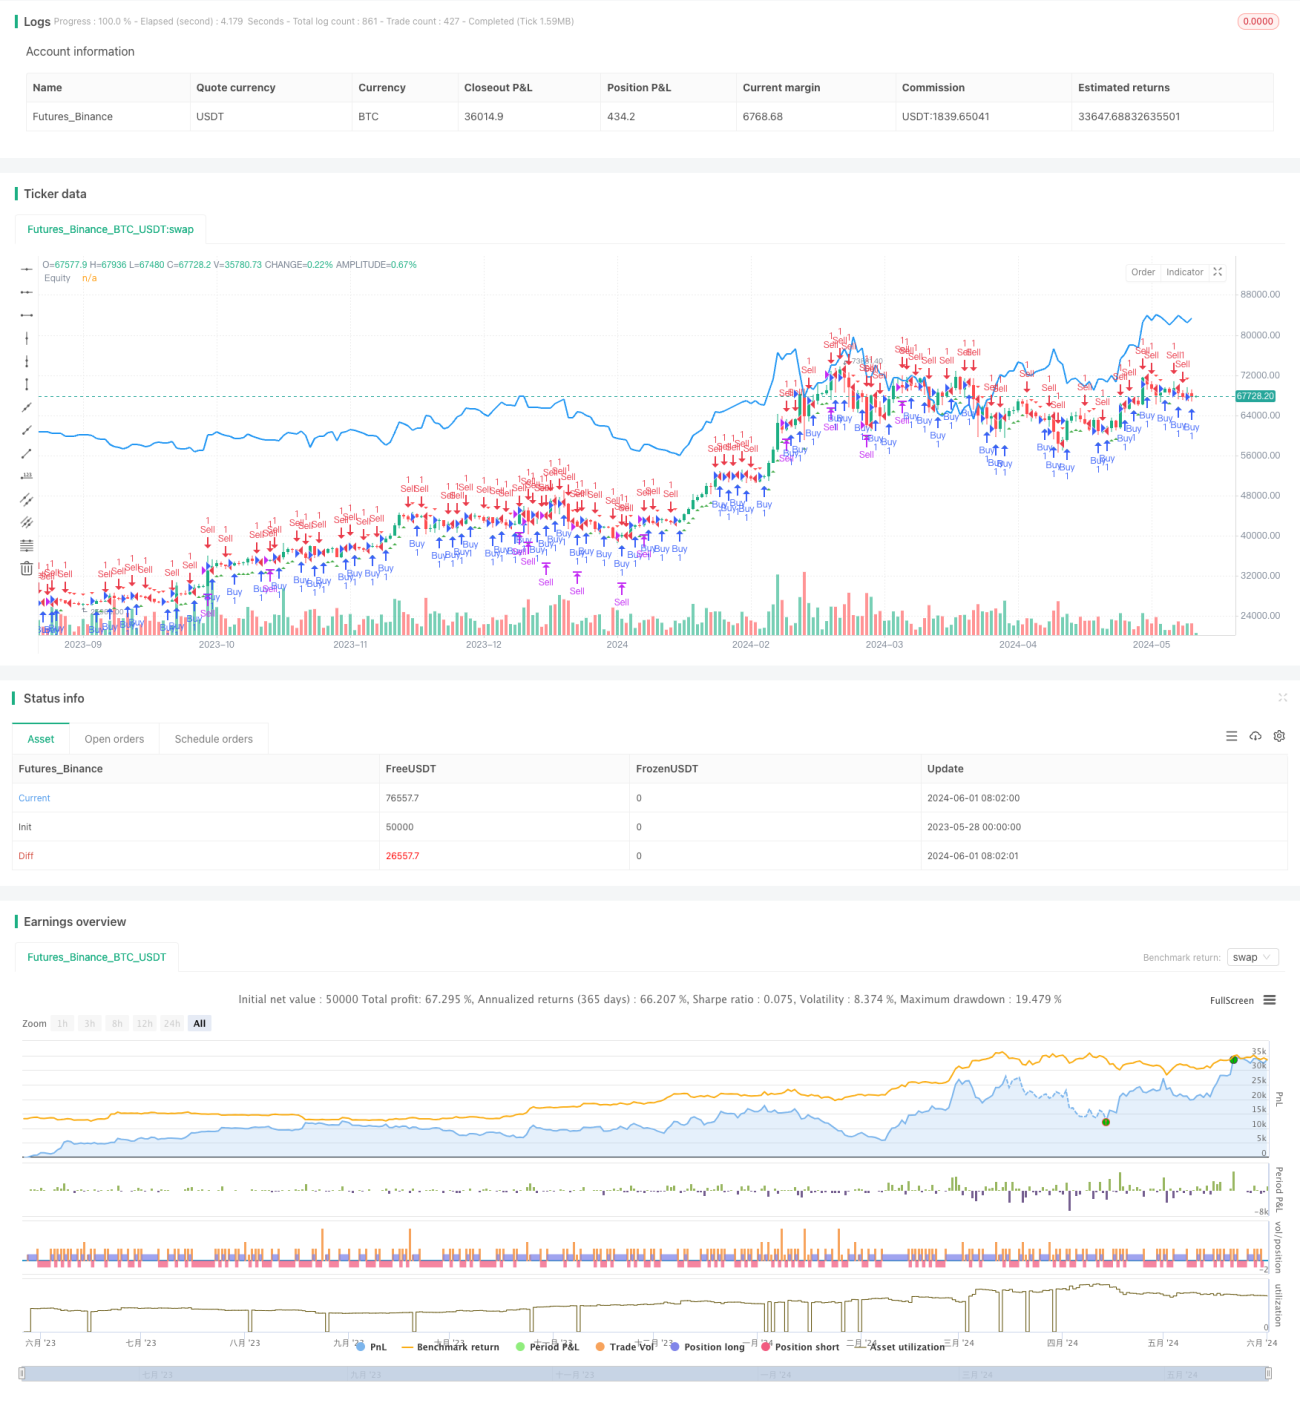
概要
この戦略は,ダイナミックなタイムフレームの高低点突破を使用して取引信号を生成する.これは,現在のタイムフレームの最高価格と最低価格と,前回のタイムフレームのクローズアップ価格加減の一定数のポイントを比較して,買い買いをするかどうかを決定する.この方法は,異なる市場動向と変動に適応し,戦略の適応性と柔軟性を向上させる.
戦略原則
この戦略の核心は,異なるタイムフレームの高低点を利用して価格動きを判断することである. まず,ユーザが選択したタイムフレームに基づいて,対応する最高価格,最低価格,および閉店価格のデータを取得する. 次に,現在のタイムフレームの最高価格が前のタイムフレームの閉店価格より大きいかどうかを比較して,一定数のポイントを加算して,買入シグナルを決定する. 同様に,現在のタイムフレームの最低価格が前のタイムフレームの閉店価格より小さいかどうかを比較して,一定数のポイントを減算して,売出シグナルを決定する.
戦略的優位性
- 適応性: ダイナミックな時間枠を使用することで,戦略は異なる市場環境と変動特性に適応し,戦略の適応性と安定性を向上させることができます.
- シンプルで理解しやすい: 戦略の論理が明確で,理解しやすく,実装しやすく,複雑な数学モデルや機械学習アルゴリズムを必要としない.
- 柔軟性: ユーザは,自分の好みや経験に応じて,タイムフレームとポイントの値下げを調整して,戦略のパフォーマンスを最適化できます.
- 直観的: グラフに買入シグナルと利権曲線を描画することで,ユーザは戦略のパフォーマンスとリスクを直観的に評価することができる.
戦略リスク
- パラメータに敏感である:戦略のパフォーマンスは,タイムフレームや点数<unk>値などのパラメータに敏感である可能性があり,不適切なパラメータ設定は,戦略の不良なパフォーマンスを引き起こす可能性があります.
- オーバーフィットするリスク:パラメータを最適化する際に歴史データをオーバーフィットすると,実際のアプリケーションで戦略がうまく機能しない可能性があります.
- 市場リスク:戦略のパフォーマンスは,市場の突発的な出来事,政策の変更などの要因に影響され,損失を引き起こす可能性があります.
戦略最適化の方向性
- 動的調整パラメータ:市場の状況と戦略のパフォーマンス,市場の変化に対応し,戦略の安定性を高めるために,タイムフレームとポイントの<unk>値などのパラメータを動的に調整する.
- リスク管理を導入する. 戦略にストップ損失,ポジション管理などのリスク管理を導入し,単一取引のリスクの<unk>値と撤回幅を低減する.
- 他の指標と組み合わせる:この戦略を他の技術指標や基本要素と組み合わせて,より堅牢で包括的な取引システムを形成する.
- コード効率の最適化: コードを最適化して改善し,戦略の実行効率と速度を向上させ,遅延や滑点などの影響を軽減する.
要約する
ダイナミックタイムフレーム高低点突破戦略は,異なるタイムフレームの価格データを活用して,高低点突破に基づいて取引信号を生成する.この戦略の論理は明確で,適応性が強く,実行しやすく,最適化できる.しかし,同時に,パラメータ感性,過適合,市場リスクなどの問題があり,実用化において継続的に最適化および改善する必要がある.パラメータを動的に調整し,リスク管理を導入し,他の指標と最適化コードと組み合わせた効率性などの措置をとることによって,戦略の安定性と収益性をさらに向上させ,取引を量化するための効果的なツールと考え方を提供することができる.
Source
Pine
Strategy parameters
Related strategies
Comment
All comments (0)
No data
- 1