10SMAとMACDのデュアルトレンドフォロー取引戦略

1
Follow
1785
Followers
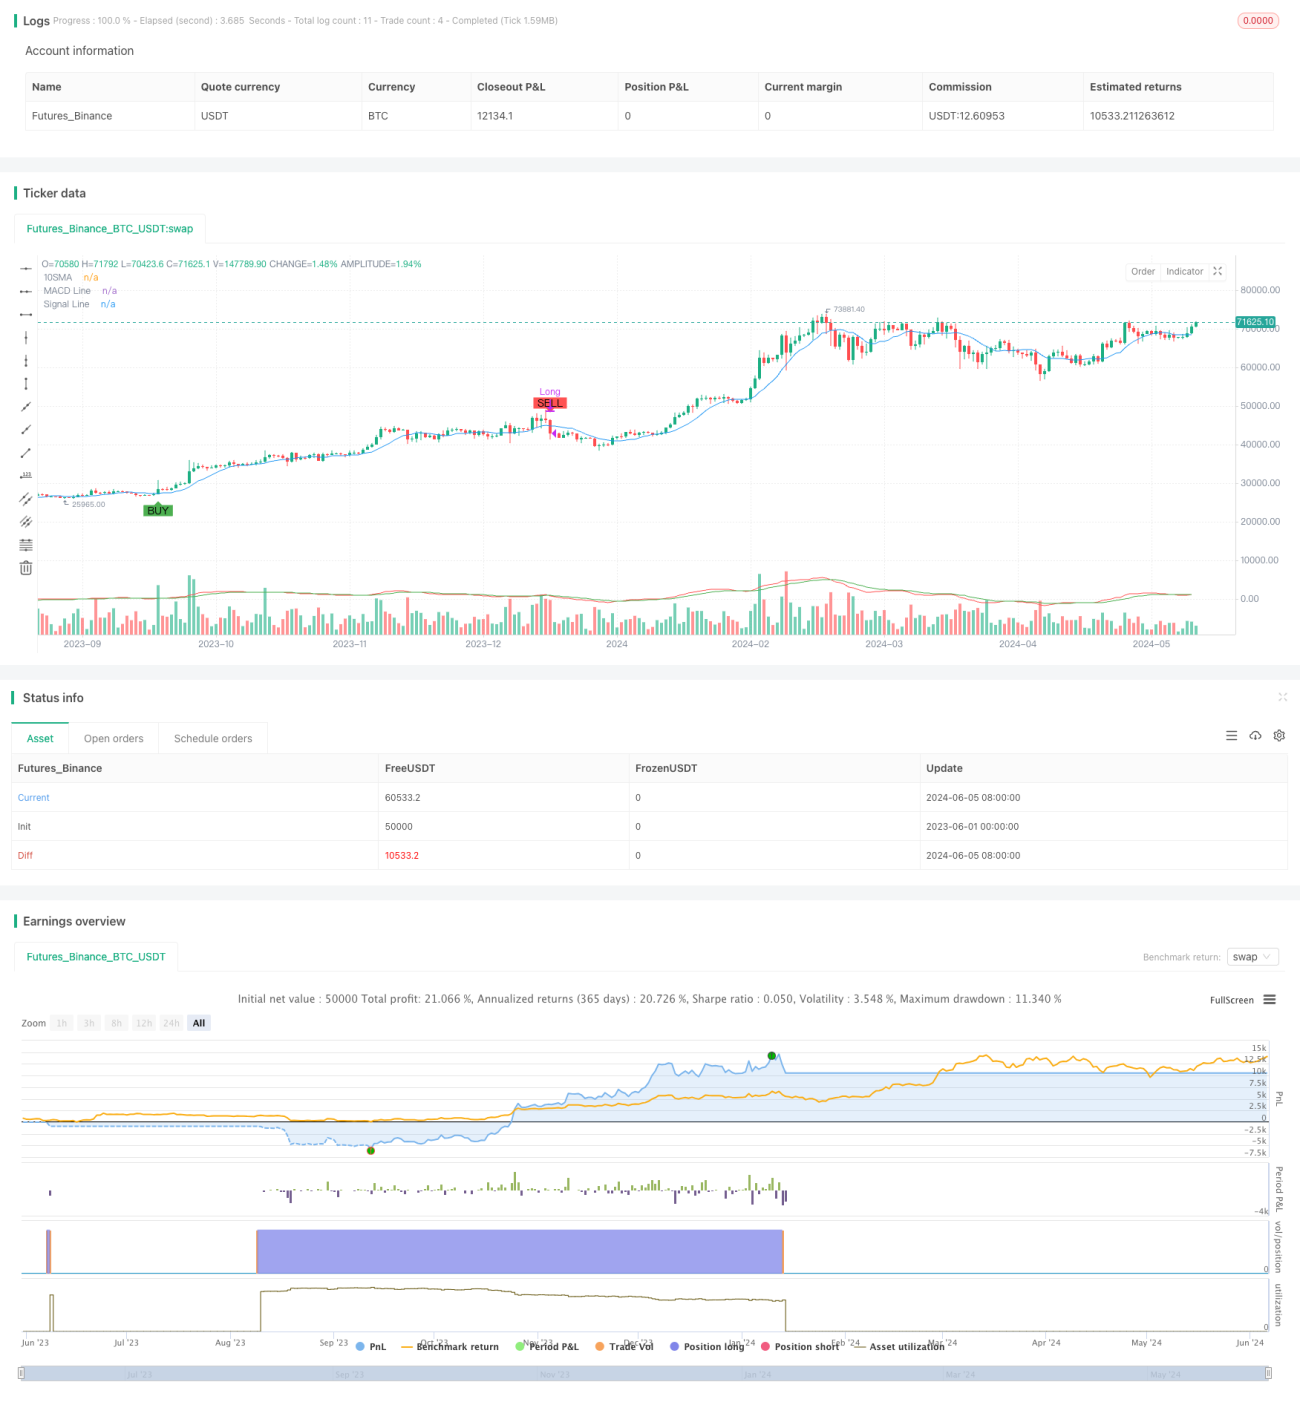
概要
この戦略は,10日単調移動平均 ((10SMA)) と移動平均収束散度指数 ((MACD)) の2つの技術指標を利用し,価格のトレンド方向を判断するためにそれらの交差信号を使用して取引決定を行う.価格が10SMAを上を通過し,MACDの快線がスローラインを穿過すると,多信号が生じ,価格が10SMAを下を通過し,MACDの快線の下のスローラインを穿過すると,平仓多信号が生じます.この戦略は,市場のトレンドの機会を捉え,同時に2つの指標の共同確認によって信号の信頼性を高めるように試みます.
戦略原則
- 価格の傾向を判断するための参照として,10SMAを計算する.価格が10SMA以上で動作するときは,多頭トレンドが優勢であることを意味し,逆に空頭トレンドが優勢であることを意味する.
- MACD指標は,短期および長期の移動平均の差値にダブルスムージングを行い,価格の傾向の強さと方向を反映します.
- 取引のシグナルを生成する:
- 複数のシグナル:現在の閉盤価格に10SMAを打つ. MACD速線にMACD慢線を打つ
- 平多シグナル:現在の閉盤価格の下10SMAを突破し,MACD速線下はMACD慢線を突破する
- トレードシグナルによる取引:
- 複数の信号が出ると,複数のポジションを開きます.
- ポジションを平らにする
この戦略の核心は,価格と10SMAの位置関係とMACDの急行線の交差を活用してトレンドを判断することであり,両指標の共同確認は,信号の有効性と信頼性を一定程度に向上させることができる.
優位分析
- シンプルで使いやすい:この戦略は2つの一般的な技術指標のみを使用し,原理はシンプルで,計算と適用は比較的簡単である.
- トレンド追跡: 10SMAとMACDの組み合わせにより,この戦略は市場の中長期のトレンドをより良く捉え,追跡することができます.
- フィルタリングノイズ: 価格または特定の指標を単独で使用して信号を生成するよりも,二つの指標の共同確認は,市場ノイズと偽の信号を一定程度にフィルタリングすることができます.
- 適応性:この戦略は,パラメータの選択に非常に敏感ではなく,適応性があり,異なる市場と品種に適用できます.
リスク分析
- 遅れのリスク:移動平均とMACDは遅れの指標であり,取引シグナルは市場動向に相対して一定の遅れがある可能性があり,最適な入場時間を逃すか,利益のスペースを減らす可能性があります.
- 振動市場リスク:振動市場では,価格と指標が頻繁に交差し,取引シグナルを生じ,過剰取引と手数料の増加を引き起こす可能性があります.
- 突発事件のリスク:この戦略は,基本的要因や突発事件の影響を考慮せずに,技術的指標に基づいて取引シグナルを生成します.ブラック天<unk>事件に直面して,大きな撤退が起こる可能性があります.
- パラメータ最適化リスク:この戦略のパフォーマンスは,パラメータ選択によって影響され,異なるパラメータは異なる結果を生じ,パラメータ最適化のリスクが存在する.
最適化の方向
- 他のフィルター条件を追加する: 信号の信頼性と有効性をさらに高めるために,取引量,波動率などの他の技術指標または条件を追加することを検討することができます.
- ストップ・ストップ・オプティマイズ: 市場特性と個人リスクの好みに応じて,適切なストップ・ストップ・条件を設定して,単一取引のリスク<unk>口と<unk>損率を制御することができる.
- 動的パラメータ最適化:パラメータ最適化方法により,異なる市場状態と品種特性に応じて,指標パラメータを動的に調整して,市場の変化に適応することができる.
- 基本的分析と統合: 戦略の総合性と有効性を高めるために,重要な経済データや政策イベントなどの要因が市場に影響を与えるように,技術的分析と基本的分析を組み合わせる.
要約する
10SMAとMACDの二重トレンドトラッキング取引戦略は,一般的な2つの技術指標の組み合わせを使用して,市場における中長期のトレンドの機会を簡単で使いやすい方法で捉えます. 一つの指標を単独で使用するよりも,2つの指標の共同承認は,信号の信頼性と有効性を一定程度向上させることができ,また一定の適応性があります. しかし,この戦略には,遅滞,振動市,突発などのリスクもあります.
Source
Pine
Strategy parameters
Related strategies
Comment
All comments (0)
No data
- 1