1
フォロー
1750
フォロワー
概要
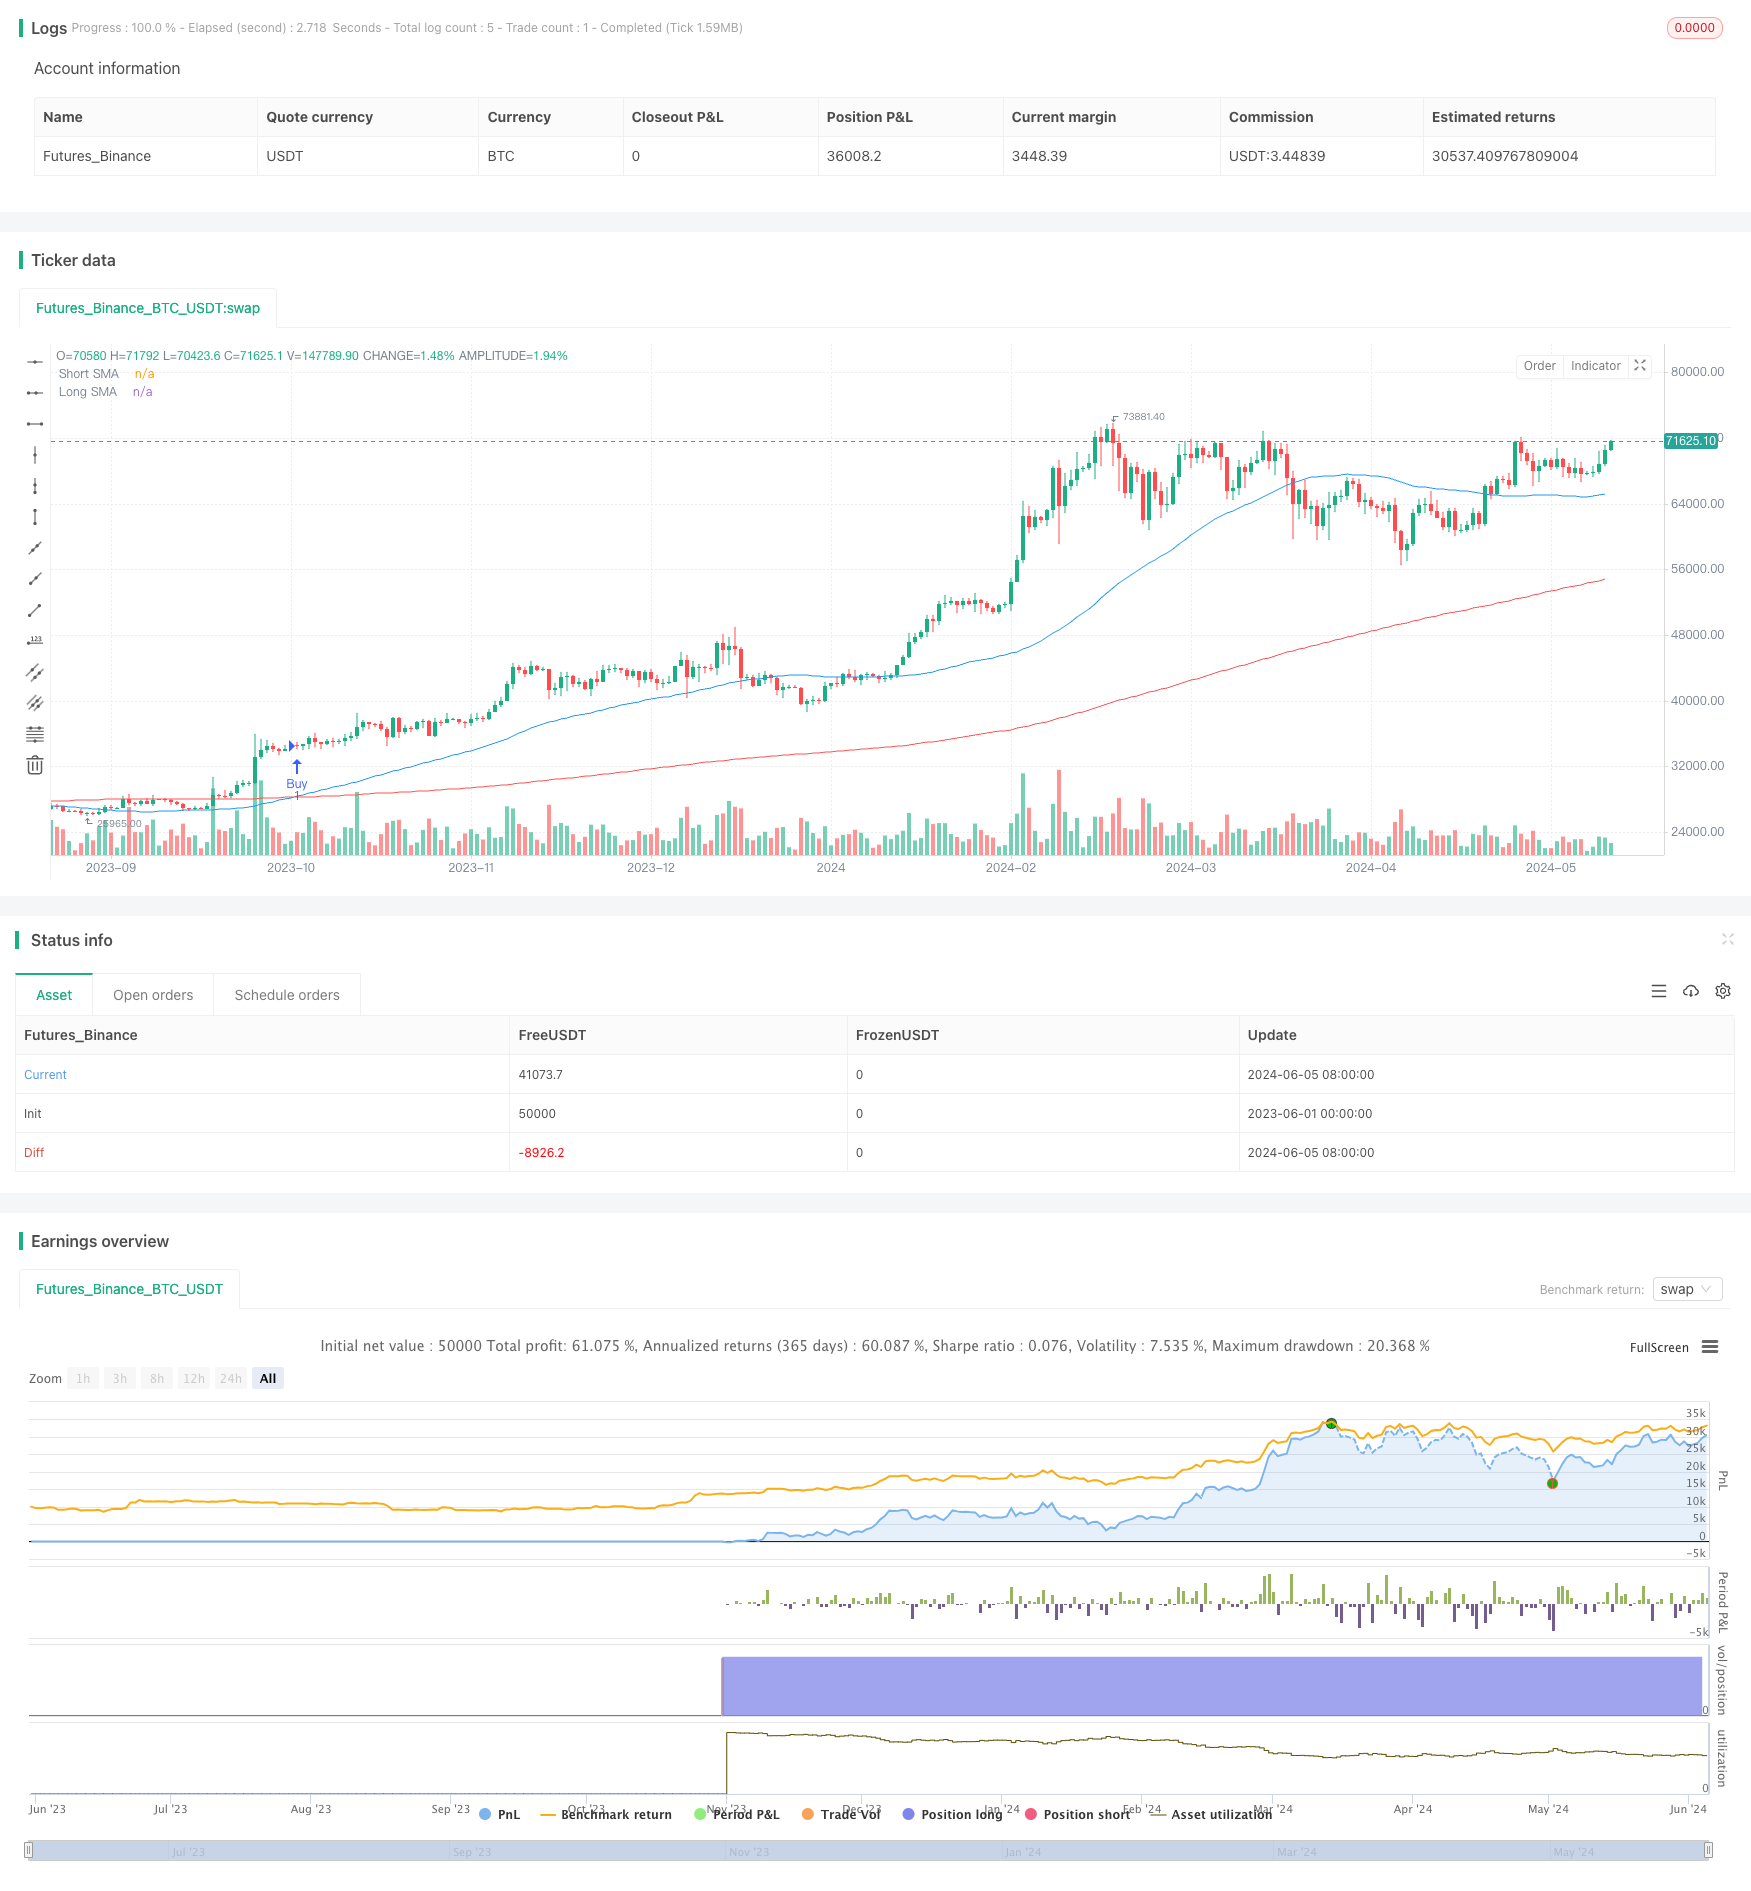
この戦略は,二均線交差原理に基づく量化取引戦略である.この戦略は,2つの異なる周期の単純な移動平均 ((SMA)) を計算することによって,短期SMA上での長期SMAの穿越時に買入シグナルを生成し,短期SMA下での長期SMAの穿越時に売り出シグナルを生成する.この戦略コードは,日付の範囲と時間枠の設定も導入し,戦略を柔軟に反測し,最適化することができる.
戦略原則
この戦略の核心原則は,異なる周期の移動平均の間の交差関係を利用して価格の傾向の変化を捉えることです.移動平均は,過去の一段の価格を平均することで,短期的な波動を排除し,価格の全体的な傾向を反映する,よく使用される技術指標です.短期移動平均の上部に長期移動平均を横断すると,価格が上昇傾向を始める可能性があることを示す,そして購入のシグナルを生成します.逆に,短期移動平均の下部に長期移動平均を横断すると,価格が下方傾向を始める可能性があることを示す,そして販売のシグナルを生成します.
戦略的優位性
- シンプルで理解しやすい: 戦略は移動平均の交差原理に基づいており,論理が明確で,理解しやすく実行できます.
- 適応性:短期および長期の移動平均の周期パラメータを調整することで,異なる市場と取引品種に適応できます.
- トレンド追跡:移動平均は,価格の全体的なトレンドを効果的に捉え,トレンド形成の初期の段階で取引を助ける.
- カスタマイズ可能: この戦略コードは,日程範囲と時間枠の設定を提供し,戦略を柔軟に反省し,最適化することができます.
戦略リスク
- パラメータに敏感である:戦略のパフォーマンスは,移動平均の周期パラメータに敏感であり,異なるパラメータ設定により異なる結果が生じることがあります.
- 頻繁に取引する:市場が波動的に動いている時や揺れ動いている時,この戦略は取引信号を多く生み出し,頻繁に取引し,高額な手数料を課す可能性があります.
- 遅延効果:移動平均は一定の遅延性があり,トレンドが形成された後に取引シグナルを発信し,最適な入場時間を逃す可能性があります.
- 突発事件:この戦略は,主に歴史的な価格データに依存し,突発的な重大事件に対する反応が不十分である可能性があります.
戦略最適化の方向性
- 他の技術指標の導入:RSI,MACDなどの他の技術指標を移動平均と組み合わせて,取引信号の信頼性を向上させることが考えられます.
- 最適化パラメータ選択: 短期および長期の移動平均の周期パラメータを最適化して,特定の市場および取引品種に適した最適なパラメータの組み合わせを見つける.
- フィルタリング条件の追加: 取引量,波動率などの追加のフィルタリング条件を導入し,偽信号の可能性をフィルタリングします.
- 動的調整パラメータ:市場の状況の変化に応じて,動的調整移動平均の周期パラメータ,異なる市場環境に適応する.
- リスク管理に参加する:合理的なストップ・ロズ・ルールとストップ・ストップ・ルールを設定し,単一取引のリスク・フローラを制御し,戦略のリスク調整後の収益を向上させる.
要約する
SMA双均線交差戦略は,簡単で分かりやすく,適応力のある量化取引戦略である.異なる周期的な移動平均の交差関係を利用することで,戦略は価格傾向の変化を効果的に捉え,トレーダーに買入と売却のシグナルを提供することができる.しかし,戦略のパフォーマンスは,パラメータ選択に敏感であり,市場波動が大きい場合,頻繁な取引と遅れの効果を生じることがあります.戦略をさらに最適化するために,他の技術指標の導入,最適化パラメータ選択,回条件の追加,動的調整パラメータ,リスク管理の追加などの措置を検討することができます.全体的に言えば,この戦略は,量化取引の基本的な戦略の1つとして機能しますが,実際のアプリケーションでは,特定の状況に応じて適切な最適化と改善が必要です.
ストラテジーソースコード
/*backtest
start: 2023-06-01 00:00:00
end: 2024-06-06 00:00:00
period: 1d
basePeriod: 1h
exchanges: [{"eid":"Futures_Binance","currency":"BTC_USDT"}]
*/

//@version=5
strategy("SMA Crossover Strategy with Date Range and Timeframe", overlay=true, default_qty_type=strategy.fixed, default_qty_value=1, initial_capital=1000, currency=currency.USD, pyramiding=0, commission_type=strategy.commission.percent, commission_value=0)

// Define the lengths for the short and long SMAs
shortSMA_length = input.int(50, title="Short SMA Length", minval=1)
longSMA_length = input.int(200, title="Long SMA Length", minval=1)

// Define the start and end dates for the backtest
startDate = input(timestamp("2024-06-01 00:00"), title="Start Date")
endDate = input(timestamp("2024-06-05 00:00"), title="End Date")

// Define the timeframe for the SMAs
smaTimeframe = input.timeframe("D", title="SMA Timeframe")

// Request the short and long SMAs from the selected timeframe
dailyShortSMA = request.security(syminfo.tickerid, smaTimeframe, ta.sma(close, shortSMA_length))
dailyLongSMA = request.security(syminfo.tickerid, smaTimeframe, ta.sma(close, longSMA_length))

// Plot the SMAs on the chart
plot(dailyShortSMA, color=color.blue, title="Short SMA")
plot(dailyLongSMA, color=color.red, title="Long SMA")

// Define the crossover conditions based on the selected timeframe SMAs
buyCondition = ta.crossover(dailyShortSMA, dailyLongSMA)
sellCondition = ta.crossunder(dailyShortSMA, dailyLongSMA)

// Generate buy and sell signals only if the current time is within the date range

if (buyCondition)
    strategy.entry("Buy", strategy.long)
if (sellCondition)
    strategy.close("Buy")

// Optional: Add visual buy/sell markers on the chart
plotshape(series=buyCondition and (time >= startDate and time <= endDate), title="Buy Signal", location=location.belowbar, color=color.green, style=shape.labelup, text="BUY")
plotshape(series=sellCondition and (time >= startDate and time <= endDate), title="Sell Signal", location=location.abovebar, color=color.red, style=shape.labeldown, text="SELL")