スーパートレンドとEMAの組み合わせ戦略

ATR EMA
作成日: 2024-06-07 15:36:41 最終変更日: 2024-06-07 15:36:41
コピー: 0 クリック数: 770
1
フォロー
1617
フォロワー

スーパートレンドとEMAの組み合わせ戦略

概要

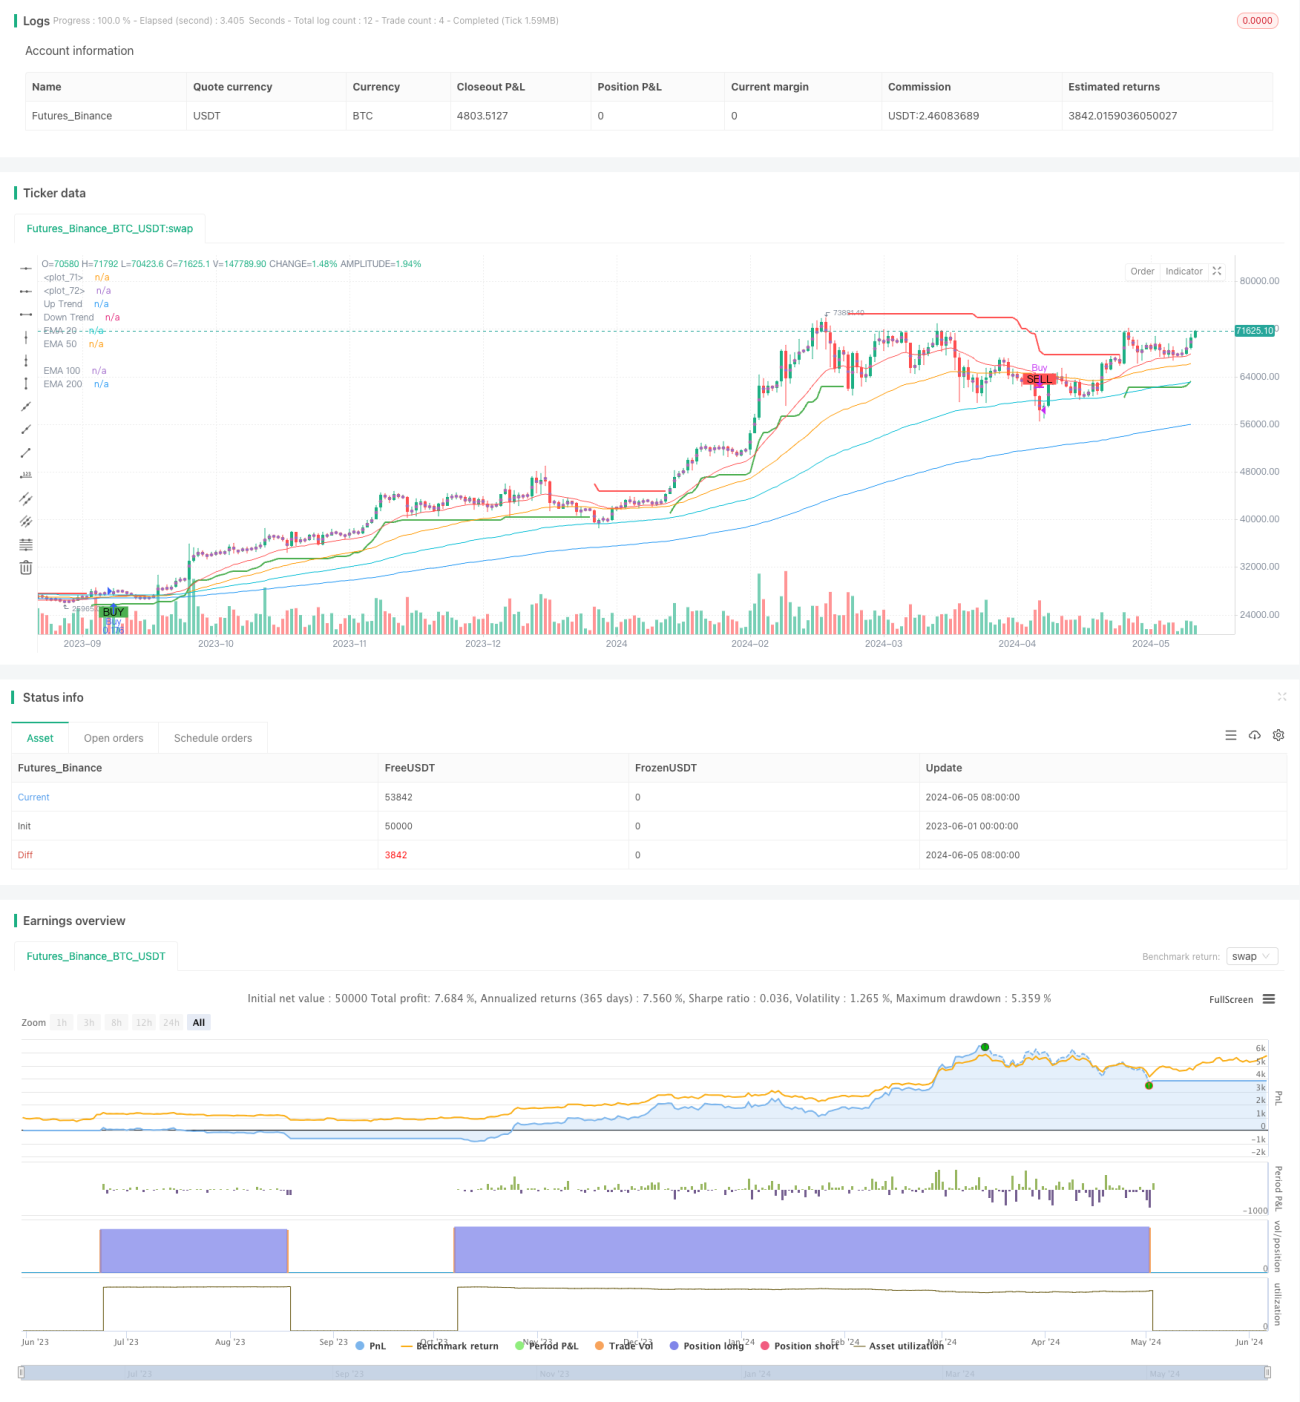
SupertrendとEMAの組み合わせ戦略は,Supertrend指標と複数のEMA指標を組み合わせて利用する取引戦略である.この戦略は,Supertrend指標によって,現在の市場のトレンド方向を判断し,同時に,異なる周期のEMA指標を,買入シグナルのトリガー条件として使用する.短期EMAと中期EMAが金叉が発生し,Supertrend指標が上昇傾向を示しているときに,買入シグナルを生成する.短期EMAと中期EMAが死叉が発生し,Supertrend指標が下降傾向を示しているときに,売出シグナルを生成する.

戦略原則

SupertrendとEMAの組み合わせ戦略の核心原則は,Supertrend指標とEMA指標の特性を利用し,市場のトレンドの変化と価格の変動を捉えることである.Supertrend指標は,現在の閉盘価格と前期の上下軌道を比較することによって,現在の市場のトレンド方向を判断する.閉盘価格が上線を突破すると,市場は上昇傾向に入ることを示す;閉盘価格が下線を突破すると,市場は下線を突破することを示す.同時に,この戦略は,四つの異なる周期のEMA指標を使用します. (20日,50日,100日,および200日),短期EMAと中期EMAの交差を比較することによって,買入シグナルを生成する.

戦略的優位性

  1. トレンド追跡能力:スーパートレンド指標は,市場のトレンドの変化を効果的に捉え,市場傾向に合わせて取引する戦略を支援します.
  2. 多重EMA確認:異なる周期のEMA指標を売買シグナルのトリガー条件として使用することで,シグナルの信頼性を高め,偽信号の発生を減らすことができる.
  3. リスク管理:スーパートレンド指標のトレンド判断により,逆行情での取引を避け,リスクを軽減します.
  4. 適応性:この戦略は,異なる市場と品種に適用することができ,優れた適応性と柔軟性を持っています.

戦略リスク

  1. パラメータ最適化リスク:スーパートレンド指標とEMA指標のパラメータ設定は,戦略のパフォーマンスに大きな影響を与える.不適切なパラメータは,戦略の失敗を引き起こす可能性があります.
  2. 市場の波動のリスク:市場の波動が激しいときに,短期EMAと中期EMAが頻繁に交差することがあり,戦略が複数の偽信号を生成する.
  3. トレンド転換のリスク:市場トレンドが逆転したとき,スーパートレンド指標は遅滞し,トレンド転換の初期に戦略が損失を伴う可能性があります.

戦略最適化の方向性

  1. パラメータ最適化:スーパートレンドの倍数とEMAの周期を最適化することで,最適なパラメータの組み合わせを見つけ,戦略の安定性と収益性を向上させる.
  2. 信号フィルタリング:EMAクロス信号が生成された後に,他の技術指標 (RSI,MACDなど) と組み合わせて,信号の二次確認を行い,信号の信頼性を高めることができる.
  3. ストップ・ストップ:合理的なストップ・ストップの仕組みを導入し,単一取引のリスクをコントロールし,戦略のリスク/利益比率を向上させる.
  4. 多種多周期:この戦略を異なる品種と周期に適用し,分散投資によって全体的なリスクを低減する.

要約する

SupertrendとEMAの組み合わせ戦略は,Supertrendの指標と複数のEMAの指標を組み合わせて,完全なトレンド追跡取引システムを形成する.この戦略は,Supertrendの指標を使用して,市場のトレンドを判断し,EMAの指標の交差状況を介して,買い売りシグナルを生成し,トレンド追跡能力が強く,シグナル確認が信頼性があり,適応性が広範囲である.しかしながら,戦略は,パラメータ最適化,市場波動およびトレンド転換などのリスクに直面し,戦略の安定性および収益性を高めるために,パラメータ最適化,シグナルフィルター,ストップ・ロズ・ストップ,多種多様なサイクルなどの方法で最適化および改善する必要があります.

ストラテジーソースコード
/*backtest
start: 2023-06-01 00:00:00
end: 2024-06-06 00:00:00
period: 1d
basePeriod: 1h
exchanges: [{"eid":"Futures_Binance","currency":"BTC_USDT"}]
*/

//@version=4
strategy("Supertrend EMA Strategy", overlay=true, default_qty_type=strategy.percent_of_equity, default_qty_value=10)

// Supertrend Parameters
atrPeriod = input(10, title="ATR Period")
src = input(hl2, title="Source")
multiplier = input(3.0, title="ATR Multiplier", step=0.1)
changeATR = input(true, title="Change ATR Calculation Method?")
showSignals = input(true, title="Show Buy/Sell Signals?")
highlighting = input(true, title="Highlighter On/Off?")

// Calculate ATR
atr = changeATR ? atr(atrPeriod) : sma(tr, atrPeriod)

// Calculate Supertrend
up = src - (multiplier * atr)
dn = src + (multiplier * atr)
up1 = nz(up[1], up)
dn1 = nz(dn[1], dn)
up := close[1] > up1 ? max(up, up1) : up
dn := close[1] < dn1 ? min(dn, dn1) : dn
trend = 1
trend := nz(trend[1], trend)
trend := trend == -1 and close > dn1 ? 1 : trend == 1 and close < up1 ? -1 : trend

// Plot Supertrend
upPlot = plot(trend == 1 ? up : na, title="Up Trend", style=plot.style_linebr, linewidth=2, color=color.green)
dnPlot = plot(trend == 1 ? na : dn, title="Down Trend", style=plot.style_linebr, linewidth=2, color=color.red)

// EMA Parameters
shortEmaLength = input(20, title="Short EMA Length")
mediumEmaLength = input(50, title="Medium EMA Length")
longEmaLength = input(100, title="Long EMA Length")
longestEmaLength = input(200, title="Longest EMA Length")

// Calculate EMA
shortEma = ema(close, shortEmaLength)
mediumEma = ema(close, mediumEmaLength)
longEma = ema(close, longEmaLength)
longestEma = ema(close, longestEmaLength)

// Plot EMA
plot(shortEma, color=color.red, title="EMA 20")
plot(mediumEma, color=color.orange, title="EMA 50")
plot(longEma, color=color.aqua, title="EMA 100")
plot(longestEma, color=color.blue, title="EMA 200")

// Define Buy and Sell Conditions
buyCondition = crossover(shortEma, mediumEma) and trend == 1
sellCondition = crossunder(shortEma, mediumEma) and trend == -1

// Plot Buy/Sell Signals
plotshape(series=buyCondition, location=location.belowbar, color=color.green, style=shape.labelup, text="BUY")
plotshape(series=sellCondition, location=location.abovebar, color=color.red, style=shape.labeldown, text="SELL")

// Add Text Labels for Buy and Sell Signals
if (buyCondition)
    label.new(bar_index, high, text="Buy", color=color.green, textcolor=color.white, style=label.style_label_up, yloc=yloc.abovebar)
if (sellCondition)
    label.new(bar_index, low, text="Sell", color=color.red, textcolor=color.white, style=label.style_label_down, yloc=yloc.belowbar)

// Strategy Entry and Exit
if (buyCondition)
    strategy.entry("Buy", strategy.long)
if (sellCondition)
    strategy.close("Buy")

// Highlight Trend
longFillColor = highlighting ? (trend == 1 ? color.green : color.white) : color.white
shortFillColor = highlighting ? (trend == -1 ? color.red : color.white) : color.white
fill(plot(ohlc4, title="", style=plot.style_circles, linewidth=0), upPlot, title="UpTrend Highlighter", color=longFillColor)
fill(plot(ohlc4, title="", style=plot.style_circles, linewidth=0), dnPlot, title="DownTrend Highlighter", color=shortFillColor)

// Alerts
alertcondition(buyCondition, title="Buy Alert", message="Supertrend EMA Buy Signal")
alertcondition(sellCondition, title="Sell Alert", message="Supertrend EMA Sell Signal")