RSIダイナミックリトレースメントストップロス戦略

1
Follow
1781
Followers
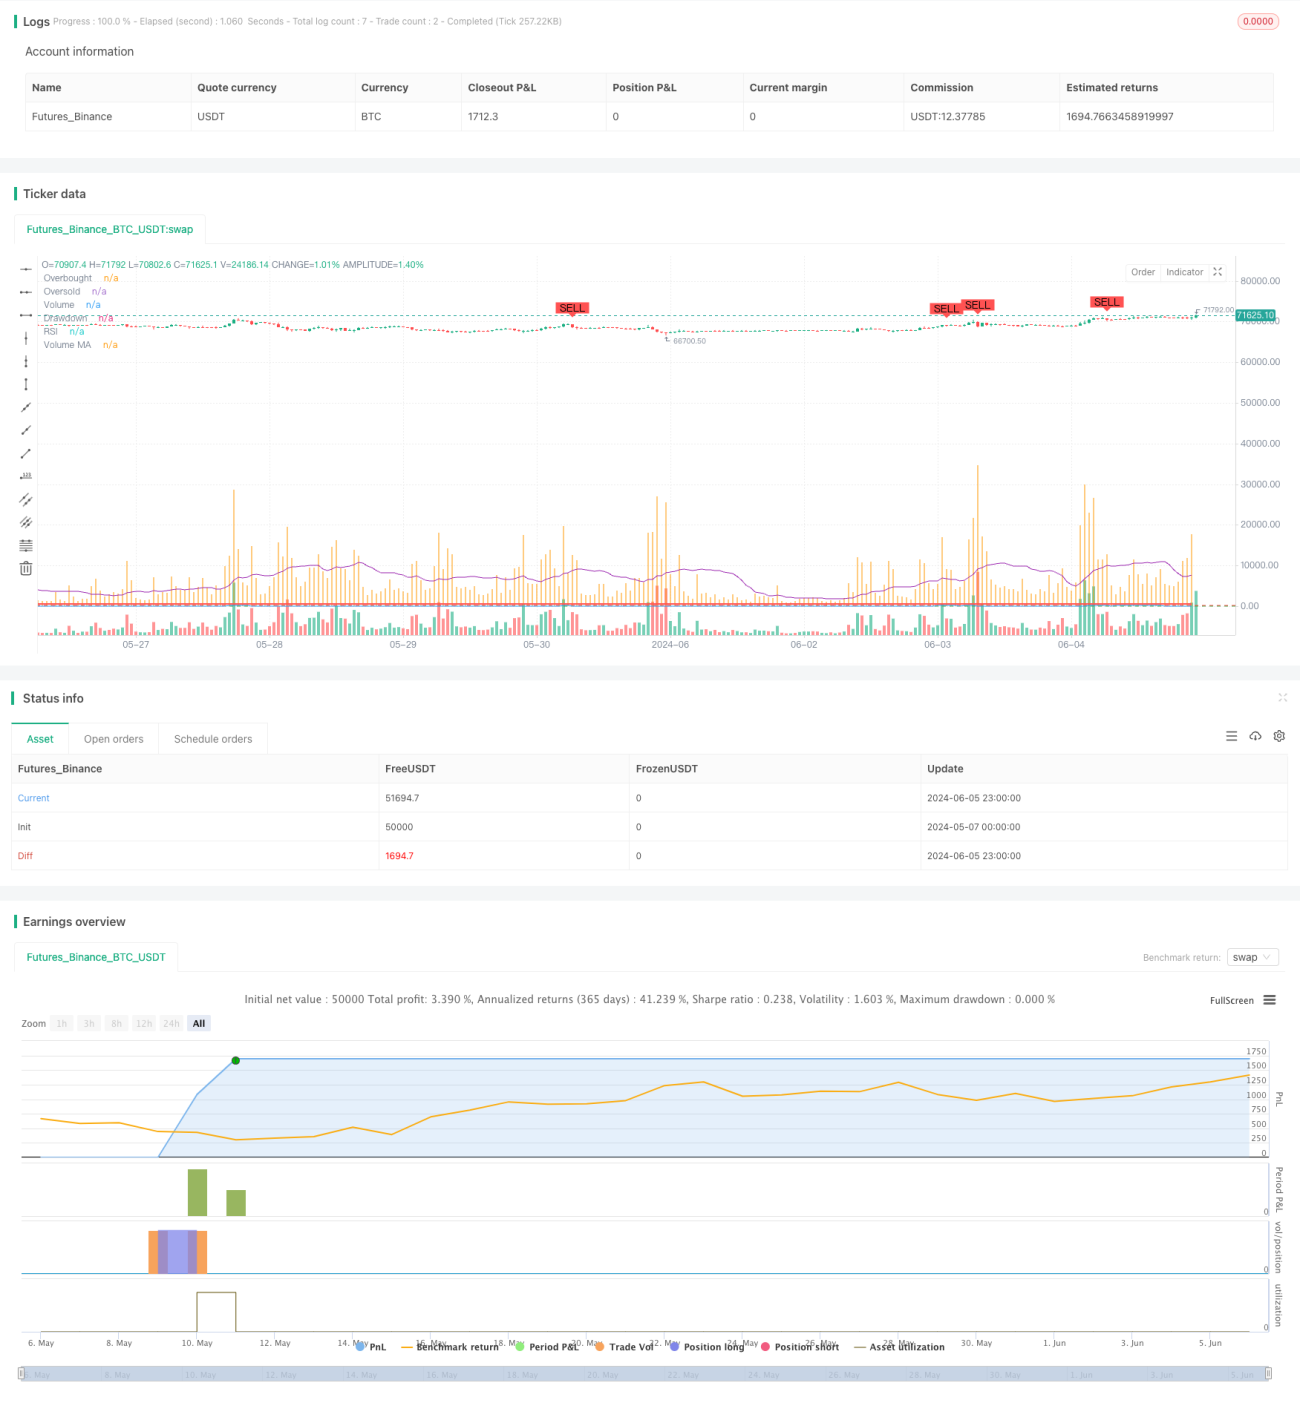
概要
この戦略は,Wyckoff方法論に基づいて,相対的に強い指数 ((RSI) と取引量移動平均 ((Volume MA) を組み合わせて,市場の累積と分配の段階を識別し,買入シグナルを生成する.同時に,この戦略は,ダイナミックな逆戻り止损機構を採用し,最大逆戻り引き下げ値を設定することによってリスクを制御する.
戦略原則
- RSIと取引量の移動平均を計算する.
- RSIが超売り区域から上方へ移動し,取引量が取引量の移動平均より大きいとき,市場蓄積段階として認識され,買取信号が生成されます.
- RSIが超買区から下を横切り,取引量が取引量の移動平均より大きいとき,市場分布段階として認識され,売り込みシグナルが生成する.
- 戦略は,アカウントの最大純額と現在の撤収を同時に追跡する.現在の撤収が設定された最大撤収の<unk>値を超えると,戦略は,すべてのポジションを平準化する.
- ポジションを購入してディストリビューション段階で平仓または最大撤収を超えた撤収,ポジションを売却して蓄積段階で平仓または最大撤収を超えた撤収.
戦略的優位性
- RSIと取引量指標を組み合わせることで,市場の蓄積と分配の段階をより正確に捉えることができます.
- ダイナミックな撤回ストップメカニズムは,戦略の最大撤回を効果的に制御し,戦略の全体的なリスクを低減する.
- 5分間の高周波データに対応し,市場の変化に迅速に対応し,ポジションをタイムリーに調整できます.
戦略リスク
- RSIと取引量指標は,特定の市場状況において,誤った取引決定を誘導する誤った信号を生成する可能性があります.
- 最大撤回<unk>値の設定は,市場の特徴と個人のリスク好みに応じて調整する必要がある.不適切な設定は,戦略を早急に平定させたり,過度のリスクを負わせたりする可能性がある.
- この戦略は,波動的な市場では頻繁に取引シグナルを生み出し,取引コストを増加させる可能性があります.
戦略最適化の方向性
- 戦略の信号精度を高めるために,MACD,ブリン帯など,他の技術指標の導入を検討することができます.
- RSIと取引量指標のパラメータを最適化します. RSIの長さを調整し,超買い超売り<unk>値など,異なる市場状況に対応します.
- 撤回ストップに加えて,移動ストップまたは利益保護メカニズムは,リスクをさらに制御し,利益をロックするために追加できます.
要約する
RSIダイナミック・レバレッジ・ストップ戦略は,RSIと取引量指標を組み合わせて,市場の累積および分配段階を識別し,同時にダイナミック・レバレッジ・ストップメカニズムを採用してリスクを制御する.この戦略は,市場動向を把握しながら,リスク管理を兼ね備えて,ある程度の実用性がある.しかし,戦略のパフォーマンスは,指標のパラメータの選択と市場の特性に依存し,継続的な最適化と調整により,その安定性と収益性を向上させる必要がある.
Source
Pine
Strategy parameters
Related strategies
Comment
All comments (0)
No data
- 1