RSIトレンド戦略

1
Follow
1780
Followers
概要
この戦略は,相対的に強い弱い指数 ((RSI) の指標に基づいて,RSIの指標の値が既定の上下<unk>値を超えているかどうかを判断することによって,買入と売却のシグナルを決定する.同時に,この戦略は,リスクを制御するために,ストップ・ロズとポジションの時間制限を設定する.
戦略原則
- RSIの値を計算する.
- RSI値が既定の買入<unk>値を下回ると買入シグナルを生成し,RSI値が既定の売り<unk>値を下回ると売りシグナルを生成する.
- 購入信号に応じて,現在の閉店価格で購入量を計算し,注文で購入する.
- ストップ・プロシージャが設定されている場合は,ストップ・価格を計算し,ストップ・オーダーを出す.
- 販売シグナルまたはストップ・ロスの条件に応じて,平仓の所有権保有.
- 最大保有期間を設定すると,保有期間が最大保有期間を超えると,利益と損失を問わず,所有保有額を平仓する.
戦略的優位性
- RSIは,市場における超買値と超売値のシグナルを効果的に捉えるために広く使用されている技術分析指標である.
- この戦略は,リスク管理に役立つストップ・ロズとポジションの時間制限を導入した.
- 戦略の論理は明確で,理解し,実行しやすい.
- RSIのパラメータと<unk>値を調整することで,異なる市場環境に対応できます.
戦略リスク
- RSI指標は,ある状況で誤った信号を発し,戦略に損失をもたらす可能性があります.
- この戦略は,取引品種の基本的要素を考慮せず,技術指標のみに依存し,市場突発のリスクを冒す可能性がある.
- 固定ストップ率は市場の変動に適応できないかもしれない.
- 策略のパフォーマンスはパラメータ設定によって影響され,不適切なパラメータは策略の不良パフォーマンスを引き起こす可能性があります.
戦略最適化の方向性
- 戦略の信頼性を高めるために,移動平均などの他の技術指標を導入する.
- モバイルストップや波動率に基づくダイナミックストップなどの最適化ストップ戦略.
- RSIのパラメータと<unk>値は,市場の状況に応じて動的に調整されます.
- 戦略のリスク管理能力を改善するために,取引品種の基本面の分析を組み合わせる.
- 戦略を反省し,パラメータを最適化して,最適なパラメータの組み合わせを見つける.
要約する
この戦略は,RSI指標を利用して市場の過剰買いと過剰販売のシグナルを捉え,リスクを管理するためにストップ・ローズとポジションの時間制限を導入する.戦略の論理は単純で,実行し,最適化することが容易である.しかし,戦略のパフォーマンスは,市場の変動とパラメータの設定の影響を受ける可能性があるため,戦略の安定性と収益性を高めるために,他の分析方法とリスク管理手段と組み合わせる必要があります.
Source
Pine
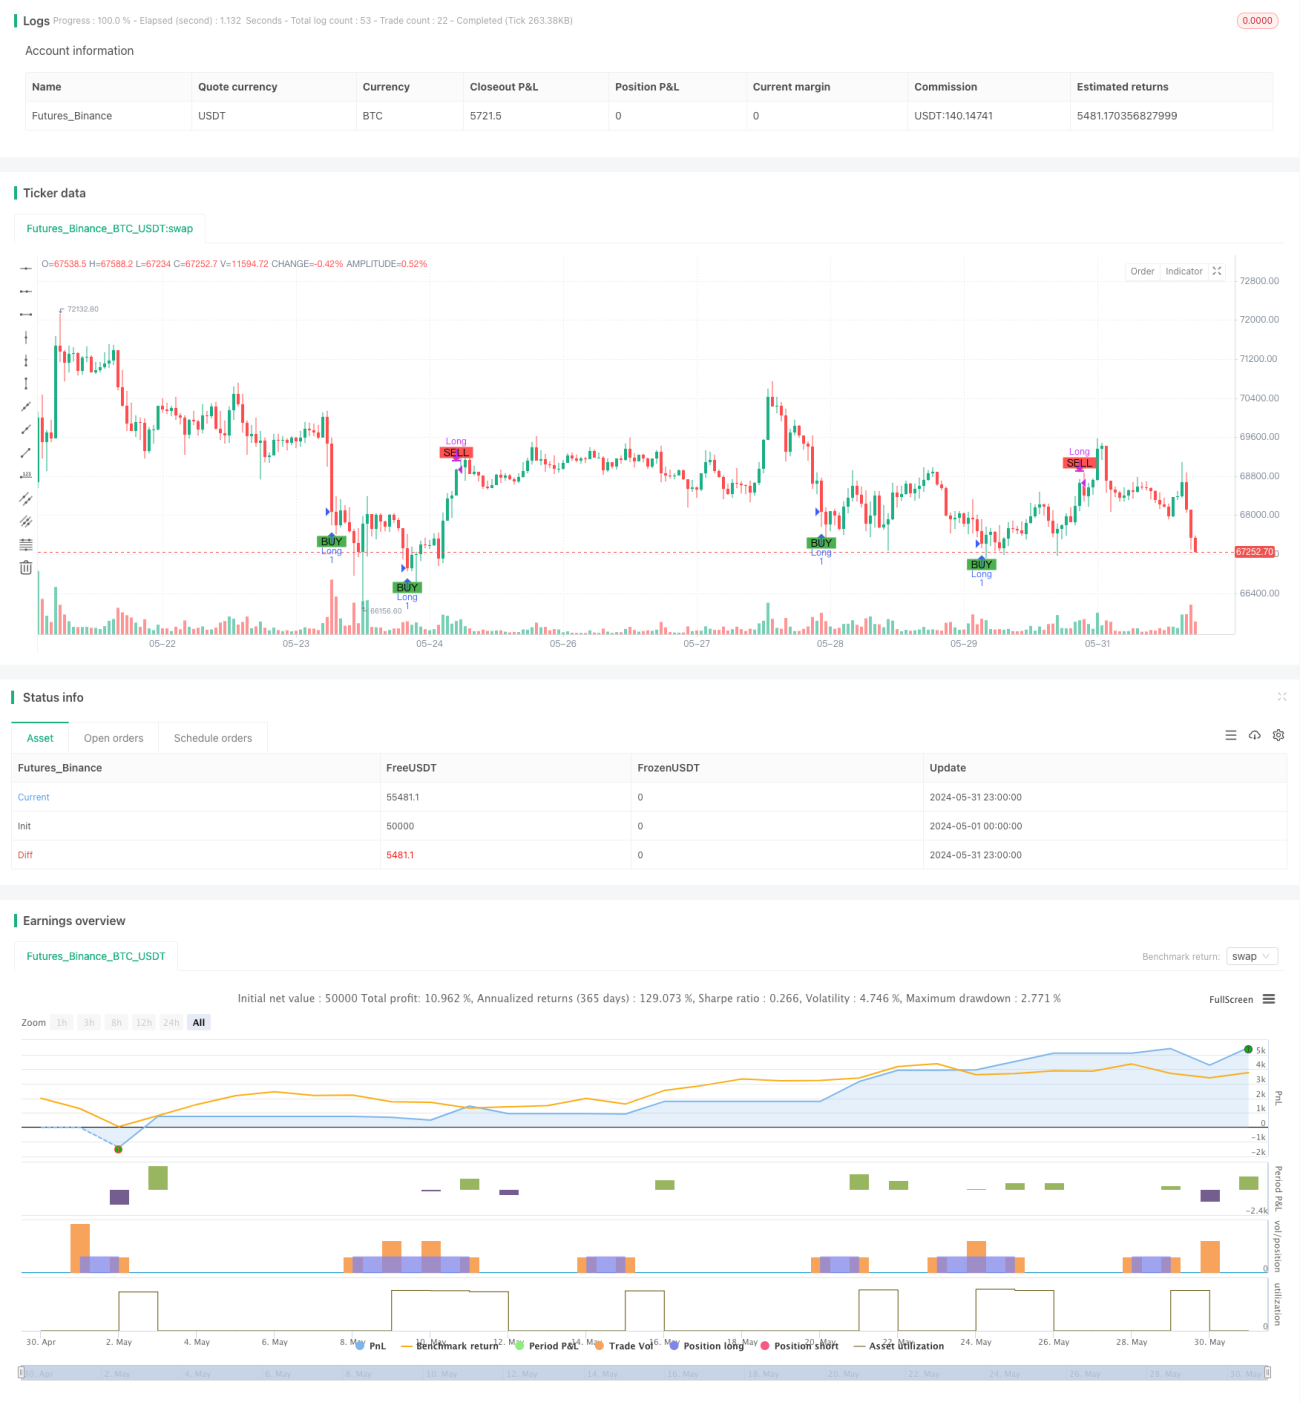
/*backtest
start: 2024-05-01 00:00:00
end: 2024-05-31 23:59:59
period: 1h
basePeriod: 15m
exchanges: [{"eid":"Futures_Binance","currency":"BTC_USDT"}]
*/

//@version=5
strategy("Simple RSI Strategy", overlay=true,  initial_capital=20, commission_value=0.1, commission_type=strategy.commission.percent)

// Define the hardcoded date (Year, Month, Day, Hour, Minute)Strategy parameters
Related strategies
Comment
All comments (0)
No data
- 1