GトレンドEMA ATRスマートトレーディング戦略

1
Follow
1781
Followers
概要
この戦略は,Gチャネル指標を使用して市場のトレンドの方向を識別し,EMAとATR指標を組み合わせて,入場と出場のポイントを最適化します.戦略の主な考え方は,価格がGチャネルを突破してEMAの下側で多めにすると,Gチャネルを突破してEMA上側で空っぽにすると,ATRを使用してダイナミックなストップとストップポジションを設定します.
戦略原則
- Gチャネルの上下軌を計算する:現在の閉店価格と以前の最高価格の最低価格を使用してGチャネルの上下軌を計算する.
- トレンドの方向を判断する:価格とGチャネルの上下関係を見ることで多空のトレンドを判断する.
- 計算するEMA:指定周期のEMA値を計算する.
- ATRを計算する:指定された周期のATR値を計算する
- 買い物条件を判断する:価格がGチャネルを突破して上線してEMAより低い時,多行をトリガーし,下線を突破してEMAより高い時,空調をトリガーする.
- ストップ・ストップを設定:ストップ・ストップは,開設価格の-2倍ATR,ストップ・ストップは,開設価格の+4倍ATR ((多頭));ストップ・ストップは,開設価格の+2倍ATR,ストップ・ストップは,開設価格の-4倍ATR ((空頭)).
- 戦略のトリガー: 買い物条件を満たしたときに,相応のポジション開設操作を実行し,相応のストップ・ロスを設定する.
戦略的優位性
- トレンド追跡:Gチャネルを利用して市場トレンドを効果的に捉え,トレンド性のある状況に適した戦略.
- 動的ストップ:ATRを利用して動的にストップを調整し,市場の波動に適した状態にします.
- リスク管理: ストップロスは2倍ATRで設定され,取引ごとにリスクが厳密に管理されます.
- シンプルで使いやすい: 戦略の論理が明確で,ほとんどの投資家が使うことができます.
戦略リスク
- 振動: 振動する市場では,頻繁に取引するシグナルが損失を増加させる可能性があります.
- パラメータ最適化:異なる品種と周期には異なるパラメータが必要であり,盲目的に使用するとリスクが生じます.
- ブラック・スイーン事件:極端な状況では,価格が激しく変動し,停止は有効に実行できない可能性があります.
戦略最適化の方向性
- トレンドフィルター: MA交差,DMIなどのトレンドフィルター条件を追加し,波動的な状況での取引を減らす.
- パラメータ最適化:異なる品種と周期に対してパラメータ最適化を行い,最適なパラメータ組み合わせを見つける.
- ポジション管理:市場の変動動向に応じてポジションを調整し,資金活用率を向上させる.
- 組み合わせ戦略:この戦略を他の有効な戦略と組み合わせて,安定性を高める.
要約する
この戦略は,Gチャネル,EMA,ATRなどの指標を介して,シンプルで効果的なトレンド追跡取引システムを構築している.トレンド行情では良い効果を得ることができるが,震動行情では一般的である.その後,トレンドフィルタリング,パラメータ最適化,ポジション管理,組み合わせ戦略などから戦略を最適化することができ,戦略の安定性と収益性をさらに向上させる.
Source
Pine
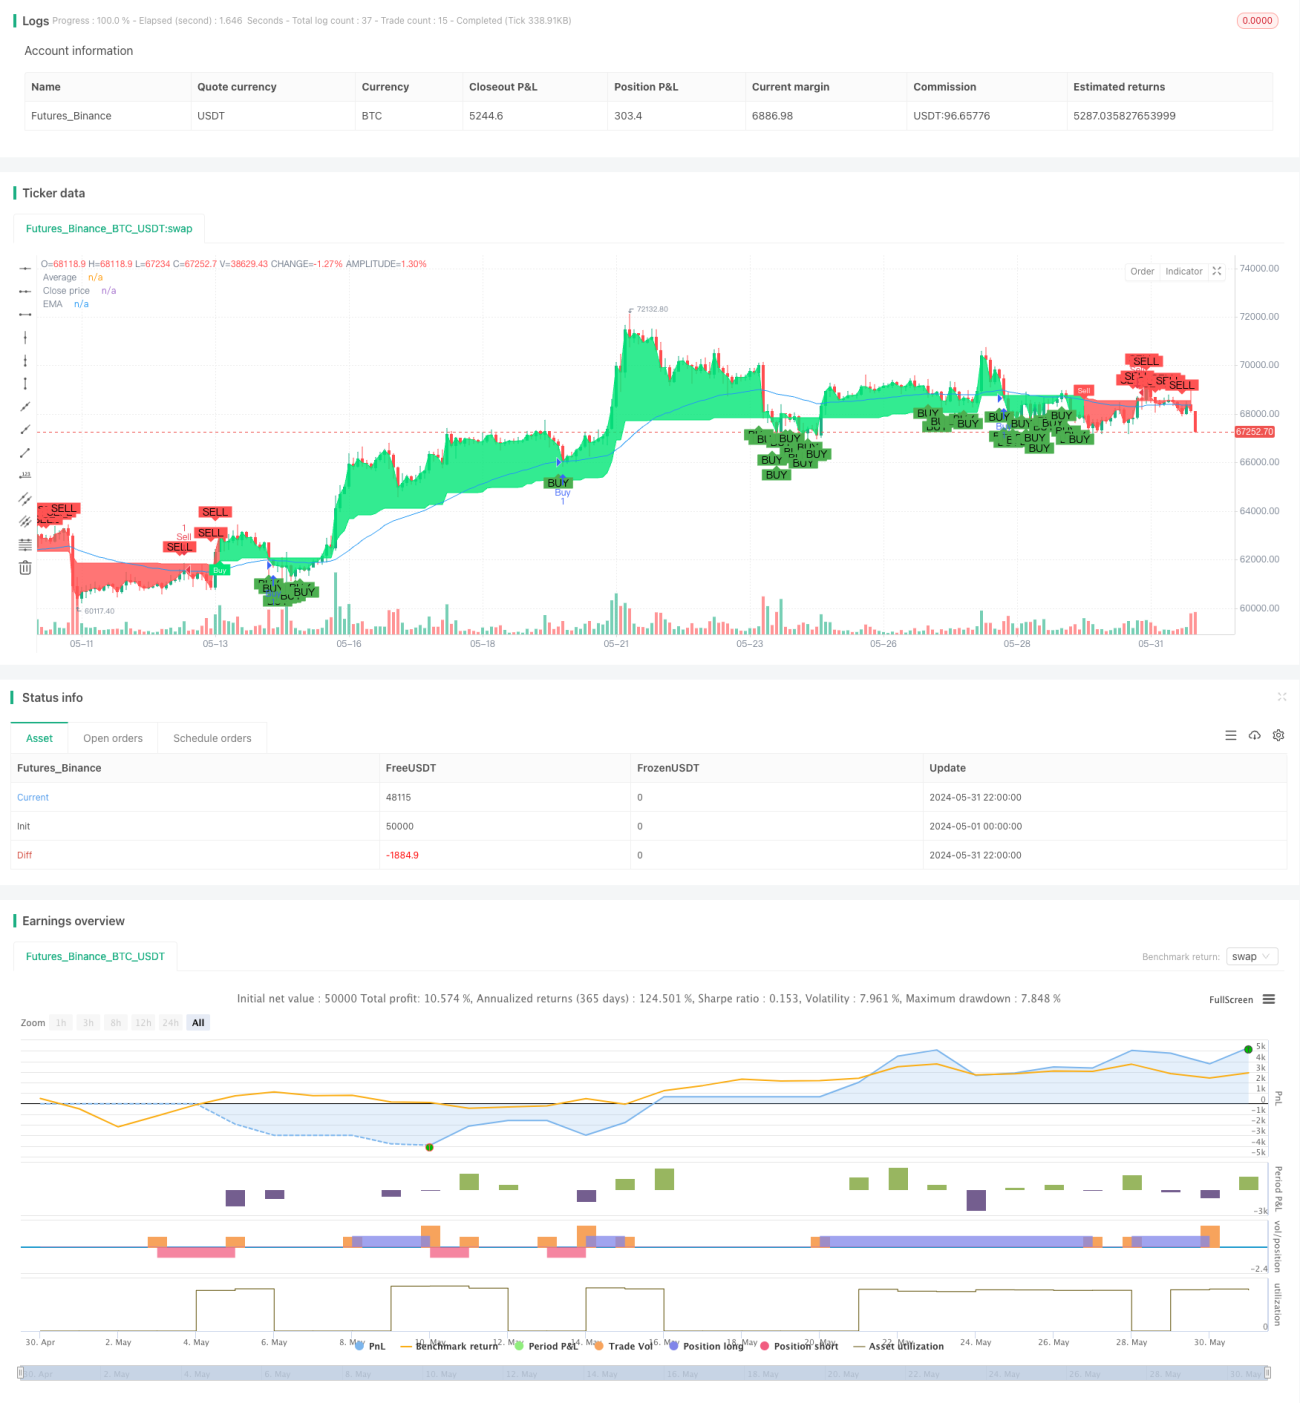
/*backtest
start: 2024-05-01 00:00:00
end: 2024-05-31 23:59:59
period: 2h
basePeriod: 15m
exchanges: [{"eid":"Futures_Binance","currency":"BTC_USDT"}]
*/

//@version=4
// Full credit to AlexGrover: https://www.tradingview.com/script/fIvlS64B-G-Channels-Efficient-Calculation-Of-Upper-Lower-Extremities/
strategy ("G-Channel Trend Detection with EMA Strategy and ATR", shorttitle="G-Trend EMA ATR Strategy", overlay=true)
Strategy parameters
Related strategies
Comment
All comments (0)
No data
- 1