EMAトレンドフィルター戦略

1
Follow
1781
Followers
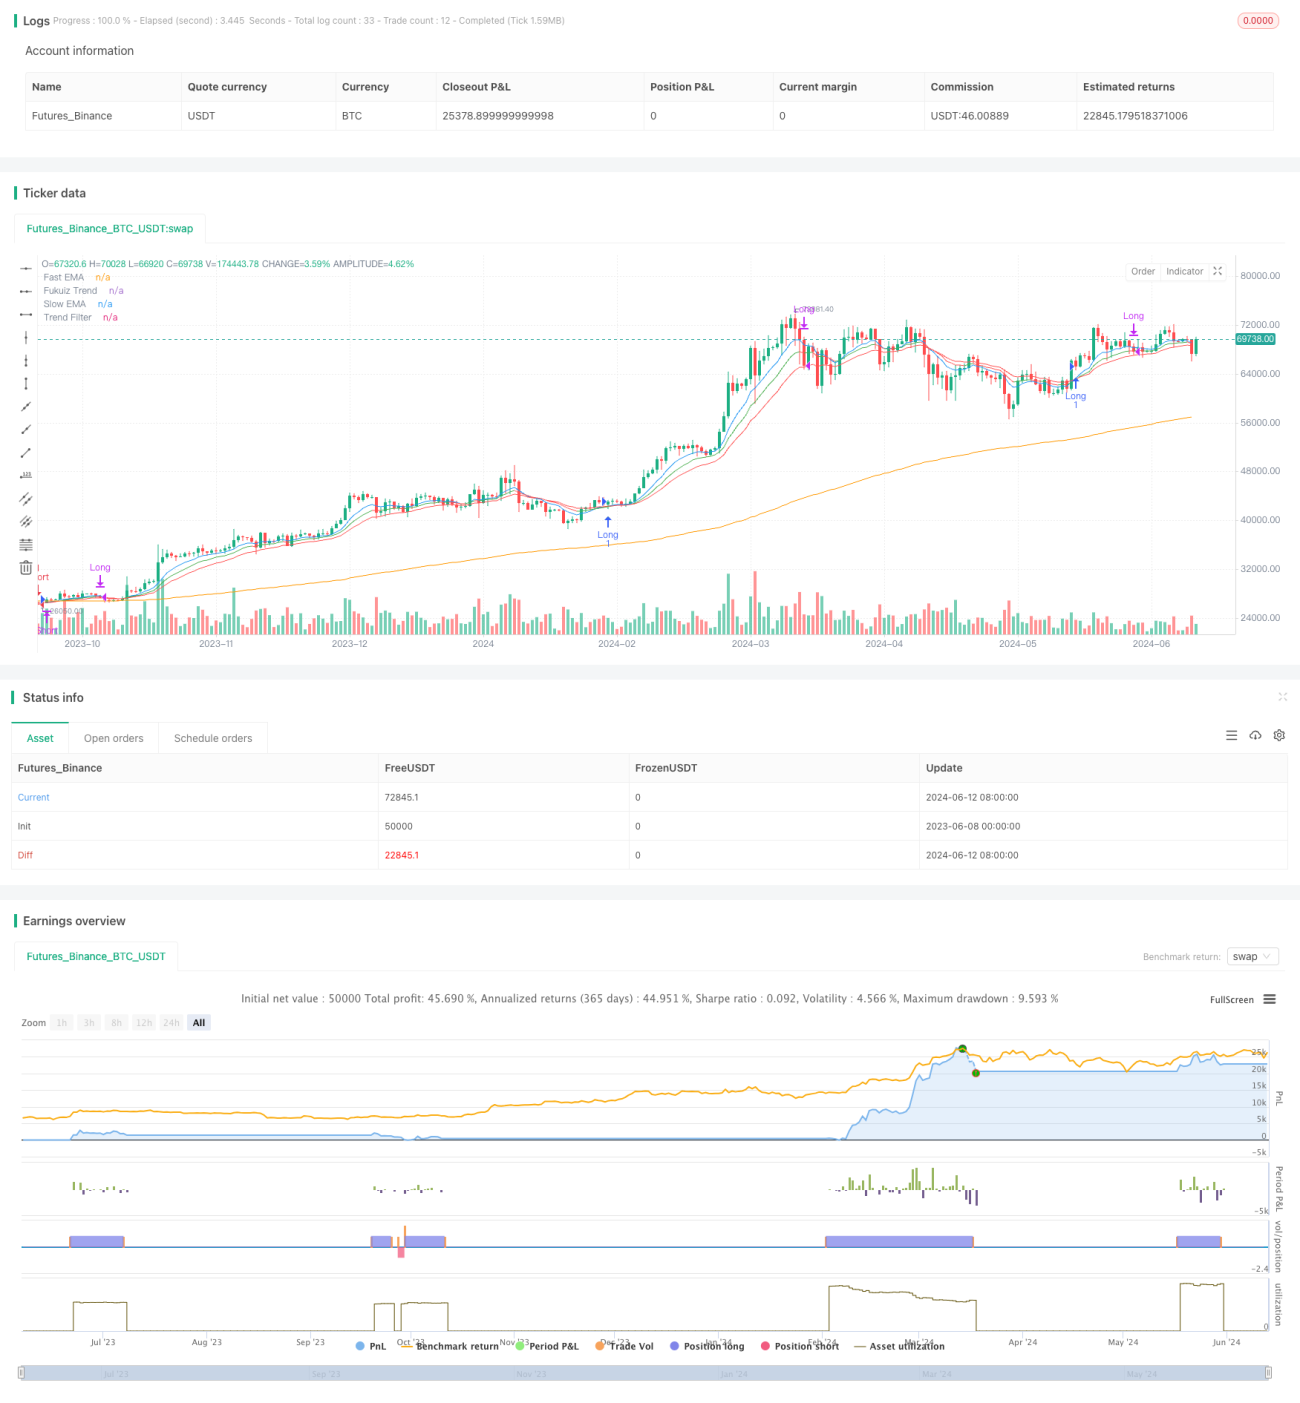
概要
この戦略は,3つの異なる周期の指数移動平均 ((EMA) を使って市場トレンドと買い物シグナルを判断する.急速EMA,遅いEMAとトレンドフィルターEMAの交差,そしてトレンドフィルターEMAの相対の価格の位置が,戦略の核心的な論理を構成する.また,この戦略は,Fukuizトレンド指標を補助的な判断として導入し,場合によっては平仓操作を誘発する.
戦略原則
- 3つの異なる周期のEMAを計算します. 急速EMA ((デフォルト9サイクル),遅いEMA ((デフォルト21サイクル) とトレンドフィルターEMA ((デフォルト200サイクル).
- 市場波動率を測定するために,20サイクル間の価格標準差を計算する.
- フクイズのトレンド指数 ((デフォルト14サイクルEMA) を導入し,前回のサイクルと大きさの関係で色を決定する ((上昇は緑,下降は赤) ≫.
- 購入シグナルが生成されるのは,高速EMAが遅いEMAを横断し,高速EMAが遅いEMAより高く,価格がトレンドフィルターEMAより高くなる場合である.
- 急速EMAが遅いEMAを横断し,急速EMAが遅いEMAより低く,価格がトレンドフィルターEMAより低いとき,セールシグナルが生成される.
- 多頭ポジションを保有している場合,Fukuizトレンドインジケーターが赤になった場合,多頭ポジションを平らにする。
- 空頭ポジションを保有しているとき,フクイズのトレンド指標が緑に変われば空頭ポジションを平らにする。
優位分析
- 複数の周期のEMAを組み合わせることで,市場動向をよりよく捉えることができます.
- Fukuizのトレンド指標の導入は,トレンド判断のための追加的な根拠を提供し,場合によっては,損失の停止の役割を果たしています.
- パラメータは調整可能で,適応性があり,異なる市場と周期に応じて最適化することができます.
リスク分析
- EMAは本質的に遅滞指数であり,市場の急速な転換時に信号が遅れる可能性があります.
- 長期のEMAをフィルターすることで,短期的なトレンドを逃してしまう可能性があります.
- Fukuizトレンド指数の平仓論理は,戦略を早めに止めて,後続トレンドを逃す可能性があります.
最適化の方向
- 各EMAの周期パラメータを最適化して,現在の市場に最も適したパラメータの組み合わせを見つけます.
- RSI,MACDなどの他の補助指標を導入し,より多くの入場と出場の根拠を提供しました.
- フクィズトレンド指数のストップロジックを最適化,例えば,特定のバッファローンを加え,早すぎるストップを避ける.
- ポジション管理とリスク管理モジュールを追加することを検討し,戦略の安定性とリスクに対する耐性を向上させる.
要約する
この戦略は,複数の周期EMAの組み合わせとFukuizトレンド指標の補助により,比較的完全なトレンド判断と取引の枠組みを構築している.戦略の論理は明確で,パラメータは調整可能で,適応性が強い.しかしながら,信号遅延,トレンド判断偏差などの潜在的なリスクもあります.将来,パラメータ最適化,指標組み合わせ,リスク管理などの面で戦略をさらに完善することができます.
Source
Pine
Strategy parameters
Related strategies
Comment
All comments (0)
No data
- 1