シンプルな組み合わせ戦略: ピボットポイントスーパートレンドと二重指数移動平均

1
Follow
1780
Followers
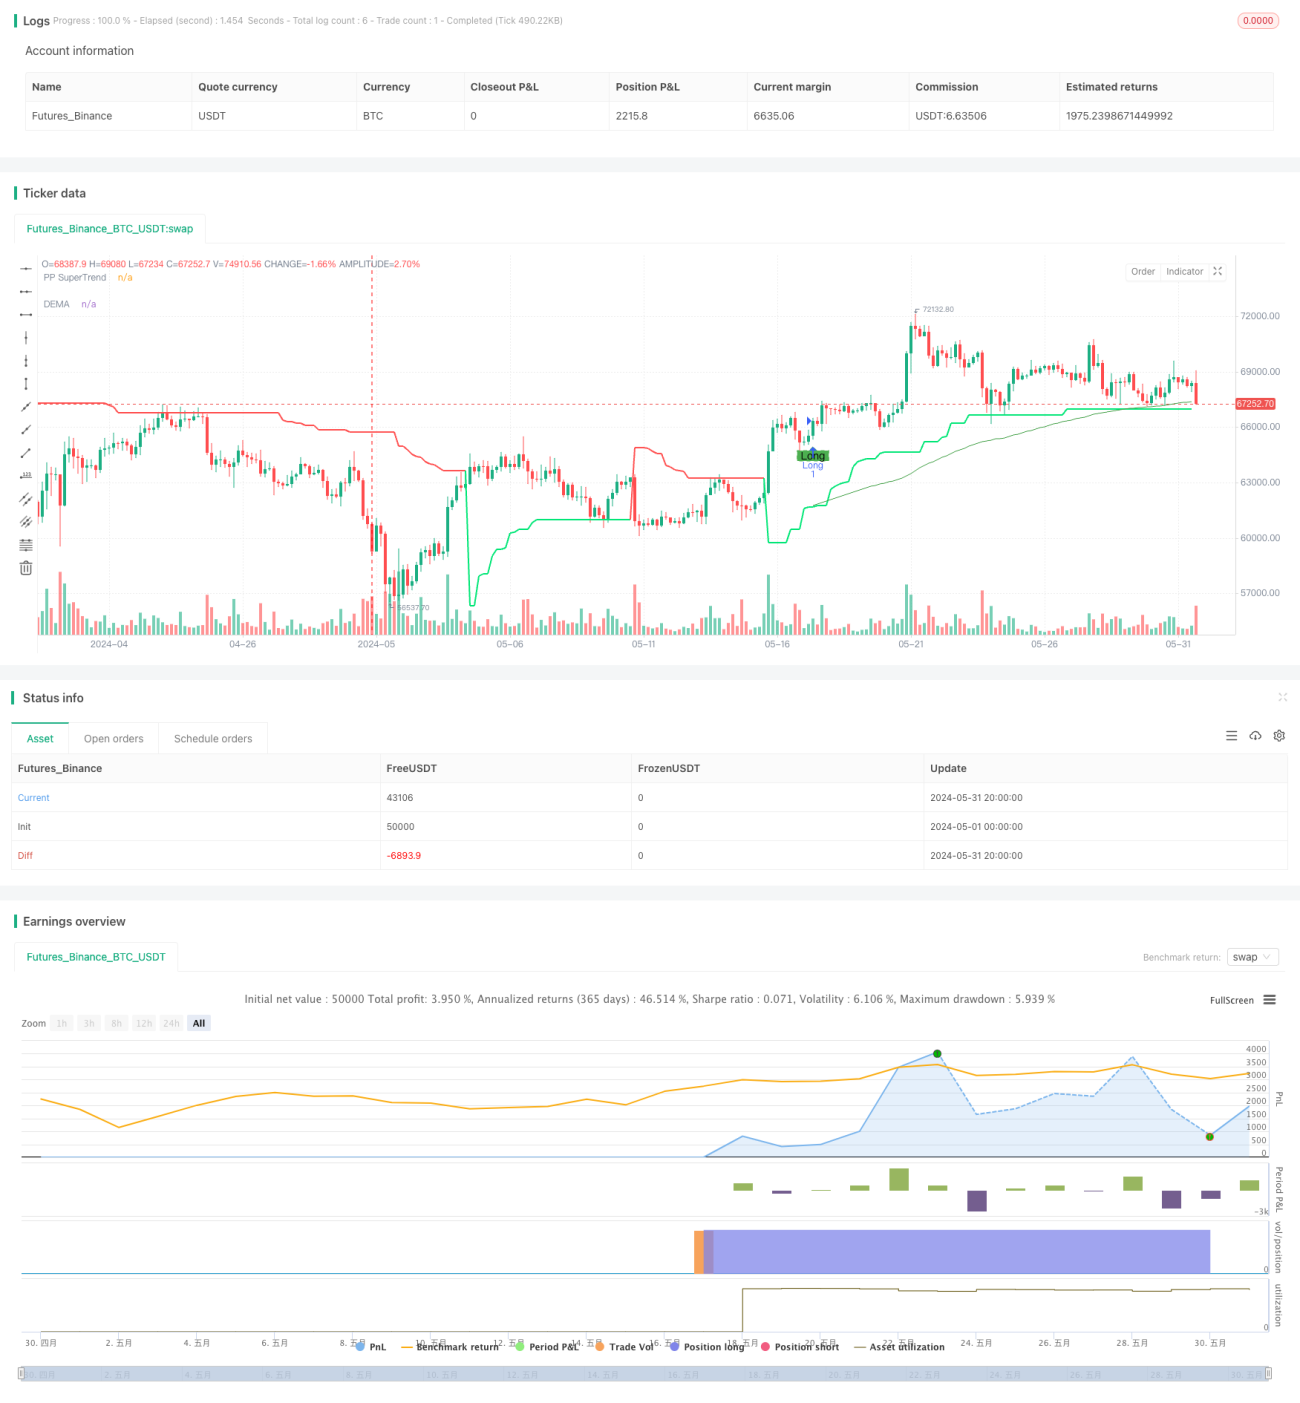
概要
この戦略は,枢軸超トレンド指数と二重指数移動平均 ((DEMA) 指数を組み合わせて,価格がこの2つの指数間の位置関係を分析することによって,取引信号を判断する.価格が枢軸超トレンド指数を破り,DEMA指数より高くなったら,多信号を生成し,価格が枢軸超トレンド指数を破り,DEMA指数より低くなったら,空信号を生成する.この戦略は,市場の中期的傾向を捉え,短期間の価格変動にも対応する.
戦略原則
- 枢軸ポイントスーパートレンド指数計算: 周期内の最高値と最低値の平均値を中心点として計算し,その後,平均真波幅 ((ATR)) に基づいて上下を計算し,ダイナミックなサポートとレジスタンス位置を形成する.
- DEMA指標を計算する.まず,閉盘価格の指数移動平均 ((EMA) を計算し,次にEMAを1度指数移動平均にすると,最後に2倍EMAをDEMAから引いて最終的なDEMA指標が得られる.
- 取引シグナルを生成する:閉盤価格が枢軸の超トレンドを突破してDEMA指数より上線したとき,多値シグナルを生成する.閉盤価格が枢軸の超トレンドを突破してDEMA指数より下線したとき,空調シグナルを生成する.
- ストップ・ロズとストップ・ストップを設定します. 特定のストップ・ロズとストップ・ストップの価格を,ピップ値と既定のストップ・ロズ・ピップとテイク・プロフィット・ピップに基づいて計算します.
戦略的優位性
- トレンド追跡能力の強さ:枢軸の超トレンド指標は市場トレンドを効果的に捉え,DEMA指標は価格のノイズを排除し,よりスムーズなトレンド判断の根拠を提供し,両者は,市場の主要なトレンドを正確に把握することができます.
- 適応性:軸の超トレンド指数の上下を動的に調整することで,異なる市場の変動状況に適応し,戦略の適応性を向上させる.
- リスク管理能力:明確なストップ・ロズとストップ・ストップの位置を設定することで,単一取引のリスクの限界を効果的に制御し,既得利益をタイムリーにロックすることができます.
戦略リスク
- パラメータ設定リスク:戦略のパフォーマンスは,枢軸点周期,ATR因子,DEMA長さなどの複数のパラメータの設定に依存し,異なるパラメータの組み合わせは,戦略のパフォーマンスの大きな差異を引き起こす可能性があり,慎重に選択して最適化する必要があります.
- 波動市場リスク:波動市場環境では,頻繁に取引するシグナルが過剰取引を引き起こし,取引コストと滑り場リスクを増やす可能性があります.
- トレンド転換リスク:市場のトレンドが逆転すると,戦略が連続して損失を伴う可能性があり,他の分析手段と組み合わせて戦略を適時調整する必要があります.
戦略最適化の方向性
- パラメータ最適化:異なる時間周期と取引品種に対するパラメータ最適化テストを行い,最適なパラメータの組み合わせを見つけ,戦略の安定性と収益性を向上させる.
- シグナルフィルター:取引シグナルが生じるとき,他の技術指標または価格行動特性と組み合わせて二次確認を行うことができ,信号の信頼性を高め,偽の信号による損失を減らす.
- ポジション管理:市場の変動や口座のリスク承受能力に応じて,取引ごとにポジションの大きさを動的に調整し,全体のリスクの<unk>を制御する.
- ポートフォリオ最適化:この戦略を他の戦略または取引システムと組み合わせ,リスクを分散し,安定性を高め,戦略の長期的なパフォーマンスを向上させる.
要約する
この戦略は,枢軸の超トレンド指標とDEMA指標を組み合わせることで,市場トレンドをよりよく捉え,短期的な変動にも対応することができる.戦略は,トレンド追跡能力,適応力,リスク管理能力などの優位性を持っているが,同時にパラメータ設定,市場の揺れ,トレンド転換などのリスクにも直面する.パラメータ最適化,シグナルフィルタリング,ポジション管理,ポートフォリオ最適化などの手段によって,戦略の安定性と収益性をさらに向上させ,異なる市場環境によりよく適応することができる.
Source
Pine
Strategy parameters
Related strategies
Comment
All comments (0)
No data
- 1