EMAダイナミックストップロス取引戦略

1
Follow
1781
Followers
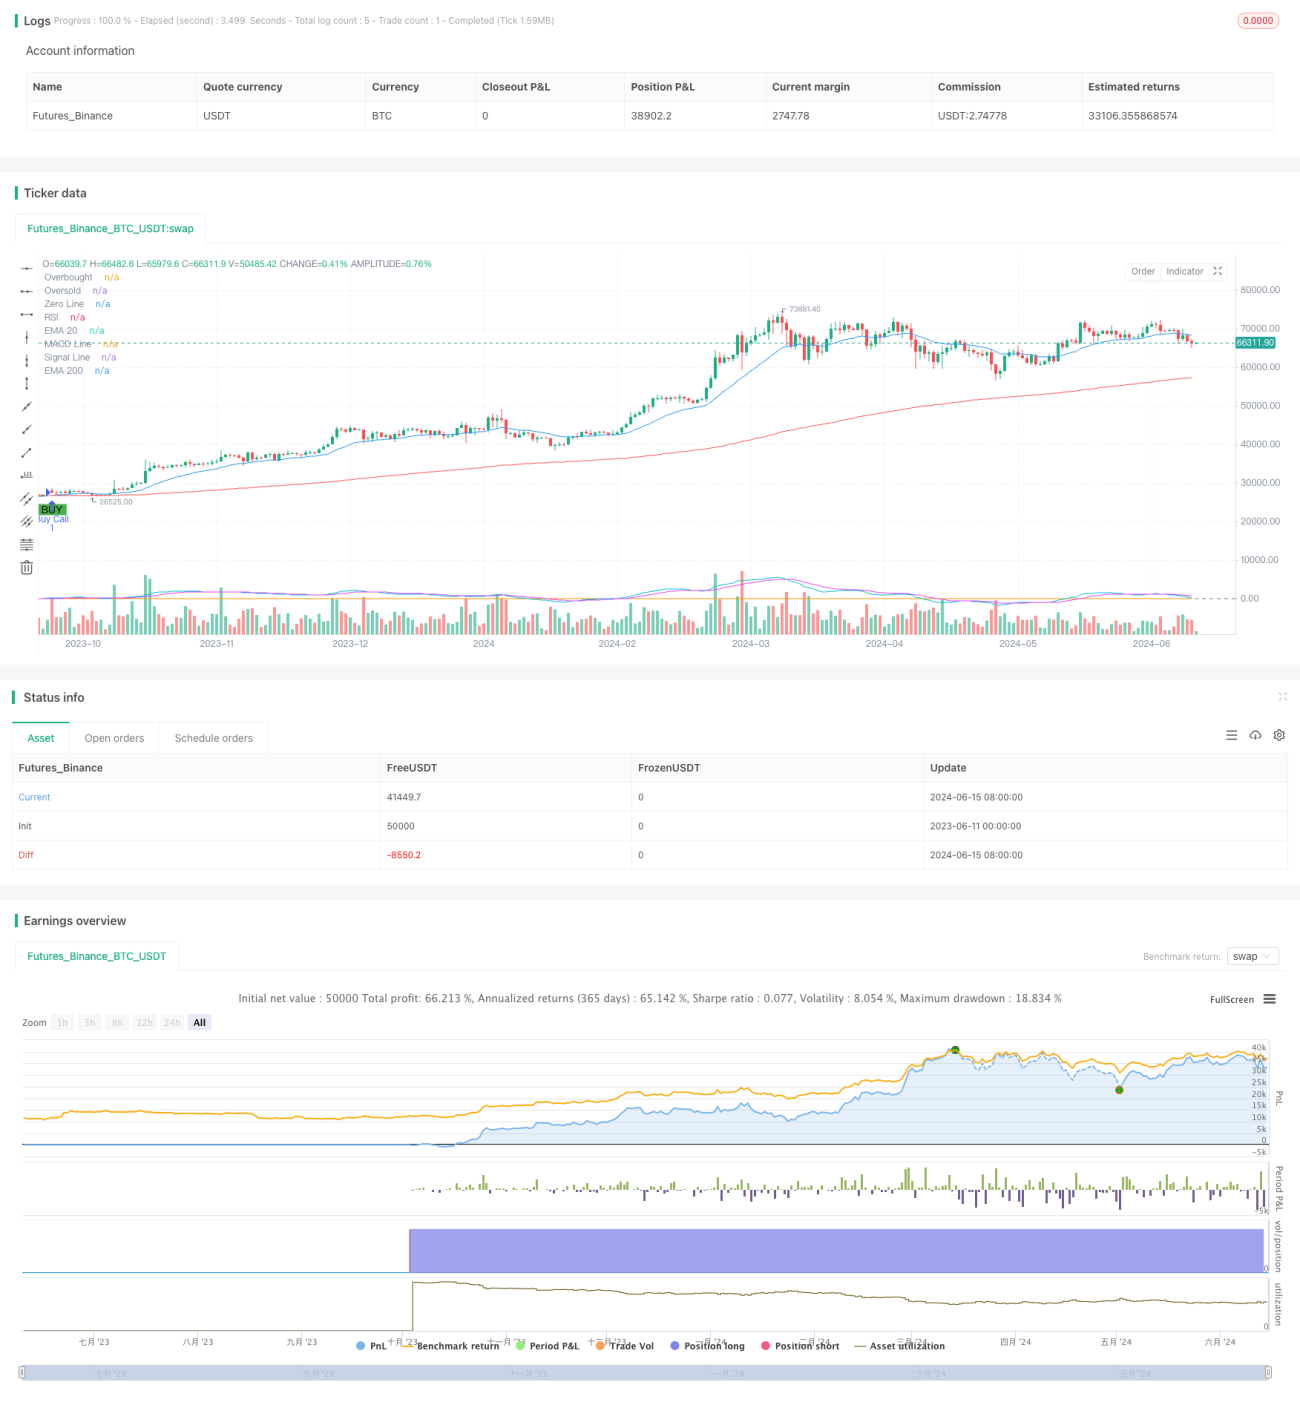
概要
この戦略は,20日目と200日目指数移動平均 ((EMA)) の交差信号に基づいており,比較的強い指標 ((RSI)) と移動平均の収束散布指標 ((MACD)) と結合して確認され,買入と売却の信号を生成する.同時に,この戦略は,ダイナミックなストップ損失と固定目標利益の方法を採用し,取引リスクを管理し,利益をロックする.
戦略原則
- 20日目と200日目EMAを計算すると,20日目EMA上から200日目EMAが通過すると,買入シグナルが生じ,20日目EMA下から200日目EMAが通過すると,売り出せシグナルが生じます.
- RSIとMACDを使用してEMAの交差信号を確認する.RSIが50より高く,MACD線が信号線より高くなる時のみ,買い物を実行する.RSIが50より低く,MACD線が信号線より低い時のみ,売りを実行する.
- 固定ターゲットの利回り (例えば20%) と初期ストップ損失率 (例えば10%) を設定する.
- 持仓利益が目標収益率に達すると,ストップ・ロスを現在の価格の10%以下に上げ,ダイナミック・ストップ・ロスを実現する.
- 価格がダイナミックストップ損失価格に触れたとき,平仓は利益を得ました.
戦略的優位性
- 複数の技術指標を組み合わせて取引シグナルを確認することで,信号の信頼性が向上する.
- ダイナミック・ストップ・メソッドを用いて,利潤をロックしながら,価格に一定の引き下げの余地を与え,早期の平仓を避ける.
- 固定リターンレートを設定することで,リスクをコントロールし,安定したリターンを得ることができます.
戦略リスク
- EMAの交差信号は,頻繁に偽信号が発生し,取引コストが増加する可能性があります.
- 波動的な市場では,この戦略は連続的な損失を招く可能性があります.
- 固定目標の利回りとストップ・ローズは,異なる市場状況に適応できない可能性があり,市場の変動に応じて調整する必要がある.
戦略最適化の方向性
- 信号の正確性と信頼性を高めるために,より多くの技術指標や市場情緒指標を導入する.
- 市場変動と資産特性に合わせて動的に調整する自己適応のターゲットの利回りと止損率を採用する.
- 市場トレンドと波動周期を組み合わせて,異なる市場環境で異なるパラメータ設定を採用する.
要約する
この戦略は,EMAの交差信号とRSIとMACDの確認,そしてダイナミックなストップと固定目標の収益のリスク管理方法によって,トレンド市場では安定した利益の実現が期待されています.しかし,揺れ動いている市場では,この戦略は,頻繁に取引され,連続的な損失の危険にさらされることがあります.したがって,戦略の適応性と安定性を高めるために,さらなる最適化と改善が必要です.
Source
Pine
Related strategies
Comment
All comments (0)
No data
- 1