EMA、RSI、TA、複数の指標取引戦略

1
Follow
1781
Followers
概要
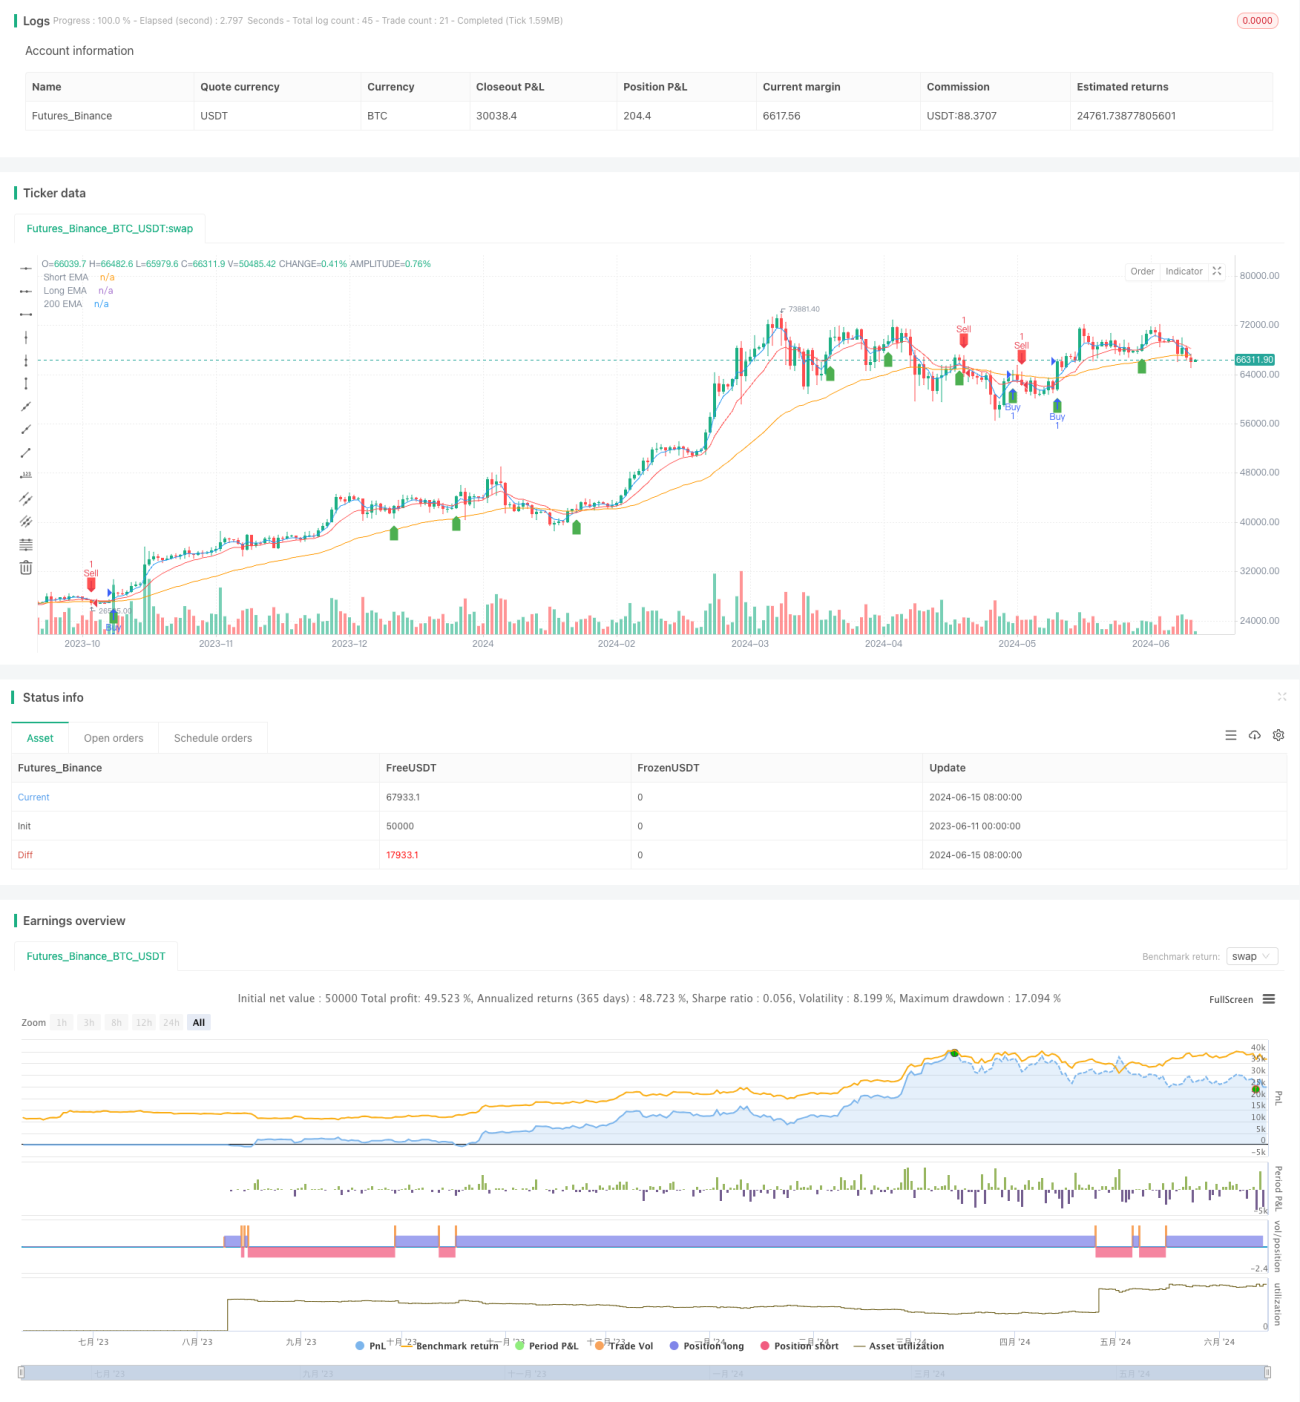
この戦略は,3つの異なる周期の指数移動平均 ((EMA) と相対的に強い指数 ((RSI) を含む複数の技術的指標を組み合わせて,それらの間の関係を分析することによって潜在的な買入シグナルを識別する.この戦略の主要な考え方は,短期,中期,および長期のEMAの交差点を利用してトレンドの方向を決定し,RSIを使用して潜在的な假期をフィルターすることです. 価格が長期EMAの上にあり,短期EMAの上部に中間EMAを突破し,RSIが超買区に達していない場合,買入シグナルが生成されます.
戦略原則
- 3つの異なる周期のEMAを計算する:短期 (デフォルト4),中期 (デフォルト12) と長期 (デフォルト48) 〜.
- RSIを計算すると,デフォルト周期は14で,超買区ではデフォルトは70,超売区ではデフォルトは30。
- 購入シグナルは,次の条件を満たす場合に発生します.
- 短期EMAが中期EMAに上昇する
- RSIが超買い領域に 達していない
- 長期EMAの上位で閉店した
- 販売シグナルは,次の条件を満たす場合に発生します.
- 短期EMAより中期EMAを横切る
- RSIは超売れ行きには至っていない.
- 長期EMA以下で閉店した
- 買い売りシグナルに応じて対応する多頭または空頭取引を実行する.
戦略的優位性
- 複数の指標の確認:この戦略は,トレンド追跡指標 ((EMA) と動力指標 ((RSI) を組み合わせて,複数の指標の共同確認によって信号の信頼性を高め,いくつかの偽信号をフィルターするのに役立ちます.
- トレンド適応性:異なる周期のEMAを使用することにより,戦略は異なる時間スケールのトレンドに適応し,短期,中期,および長期のトレンドの変化を捉えます.
- リスクコントロール:RSIの超買い超売り条件によって,市場が逆転する可能性のある時に取引を避ける戦略で,ある程度リスクがコントロールされます.
- シンプルで使いやすい:この戦略の論理は明確で,使用される指標はシンプルで実用的で,理解し,適用しやすい.
戦略リスク
- パラメータ最適化リスク:この戦略のパフォーマンスは,EMAとRSIのパラメータ選択に依存し,異なるパラメータは異なる結果につながる可能性があります.パラメータが十分に反測され,最適化されていない場合,戦略の不良パフォーマンスを引き起こす可能性があります.
- 震動市場リスク: 震動市場条件下では,頻繁なEMA交差が過剰な取引信号を引き起こし,取引コストを増加させ,戦略の効率を低下させる可能性があります.
- トレンド逆転のリスク:この戦略は,トレンドが確立された後に信号を発信し,トレンドの初期の一部の利益を逃す可能性があります.また,トレンドが突然逆転したとき,この戦略は,十分なタイミングで反応せず,一定の損失を招く可能性があります.
戦略最適化の方向性
- ダイナミックパラメータ最適化: 遺伝的アルゴリズムやグリッド検索のようなダイナミックパラメータ最適化方法を使用して,異なる市場条件下で最適なパラメータの組み合わせを見つけ,戦略の適応性と安定性を向上させる方法を検討する.
- 他のフィルタ条件を追加:信号の質をさらに向上させるために,取引量,波動率などの他の技術指標または市場情緒指標をフィルタ条件として追加することを検討することができます.
- トレンド強度確認:取引シグナルを生成する前に,トレンド強度 (ADX指数など) を分析してトレンドの信頼性を確認し,弱いトレンドまたはトレンドのない市場での取引を避ける.
- ストップ・ストップの最適化: リスクの管理と利益の保護のために,移動ストップや変動率に基づく動的ストップなどのより高度なストップ・ストップ戦略を導入する.
要約する
この戦略は,3つの異なる周期のEMAとRSIの指標を組み合わせて,シンプルで効果的なトレンド追跡取引システムを形成する. それはトレンドの方向性を識別するためにEMAの交差を活用し,RSIを通じて偽の信号をフィルターし,トレンドをキャプチャしながらリスクを制御する. この戦略には,パラメータ最適化リスクとトレンド逆転リスクなどのいくつかの限界があるにもかかわらず,ダイナミックなパラメータの選択,他のフィルター条件の追加,およびストップ・ストップ戦略の改善などのさらなる最適化により,この戦略の適応性と健全性を向上させ,より完全で信頼性の高い取引システムにすることができます.
Source
Pine
/*backtest
start: 2023-06-11 00:00:00
end: 2024-06-16 00:00:00
period: 1d
basePeriod: 1h
exchanges: [{"eid":"Futures_Binance","currency":"BTC_USDT"}]
*/

// This Pine Script™ code is subject to the terms of the Mozilla Public License 2.0 at https://mozilla.org/MPL/2.0/
// © fitradn
//@version=4
//@version=4Strategy parameters
Related strategies
Comment
All comments (0)
No data
- 1