SMAクロスオーバーロングおよびショート戦略とピークリトレースメント制御および自動終了を組み合わせたもの
SMA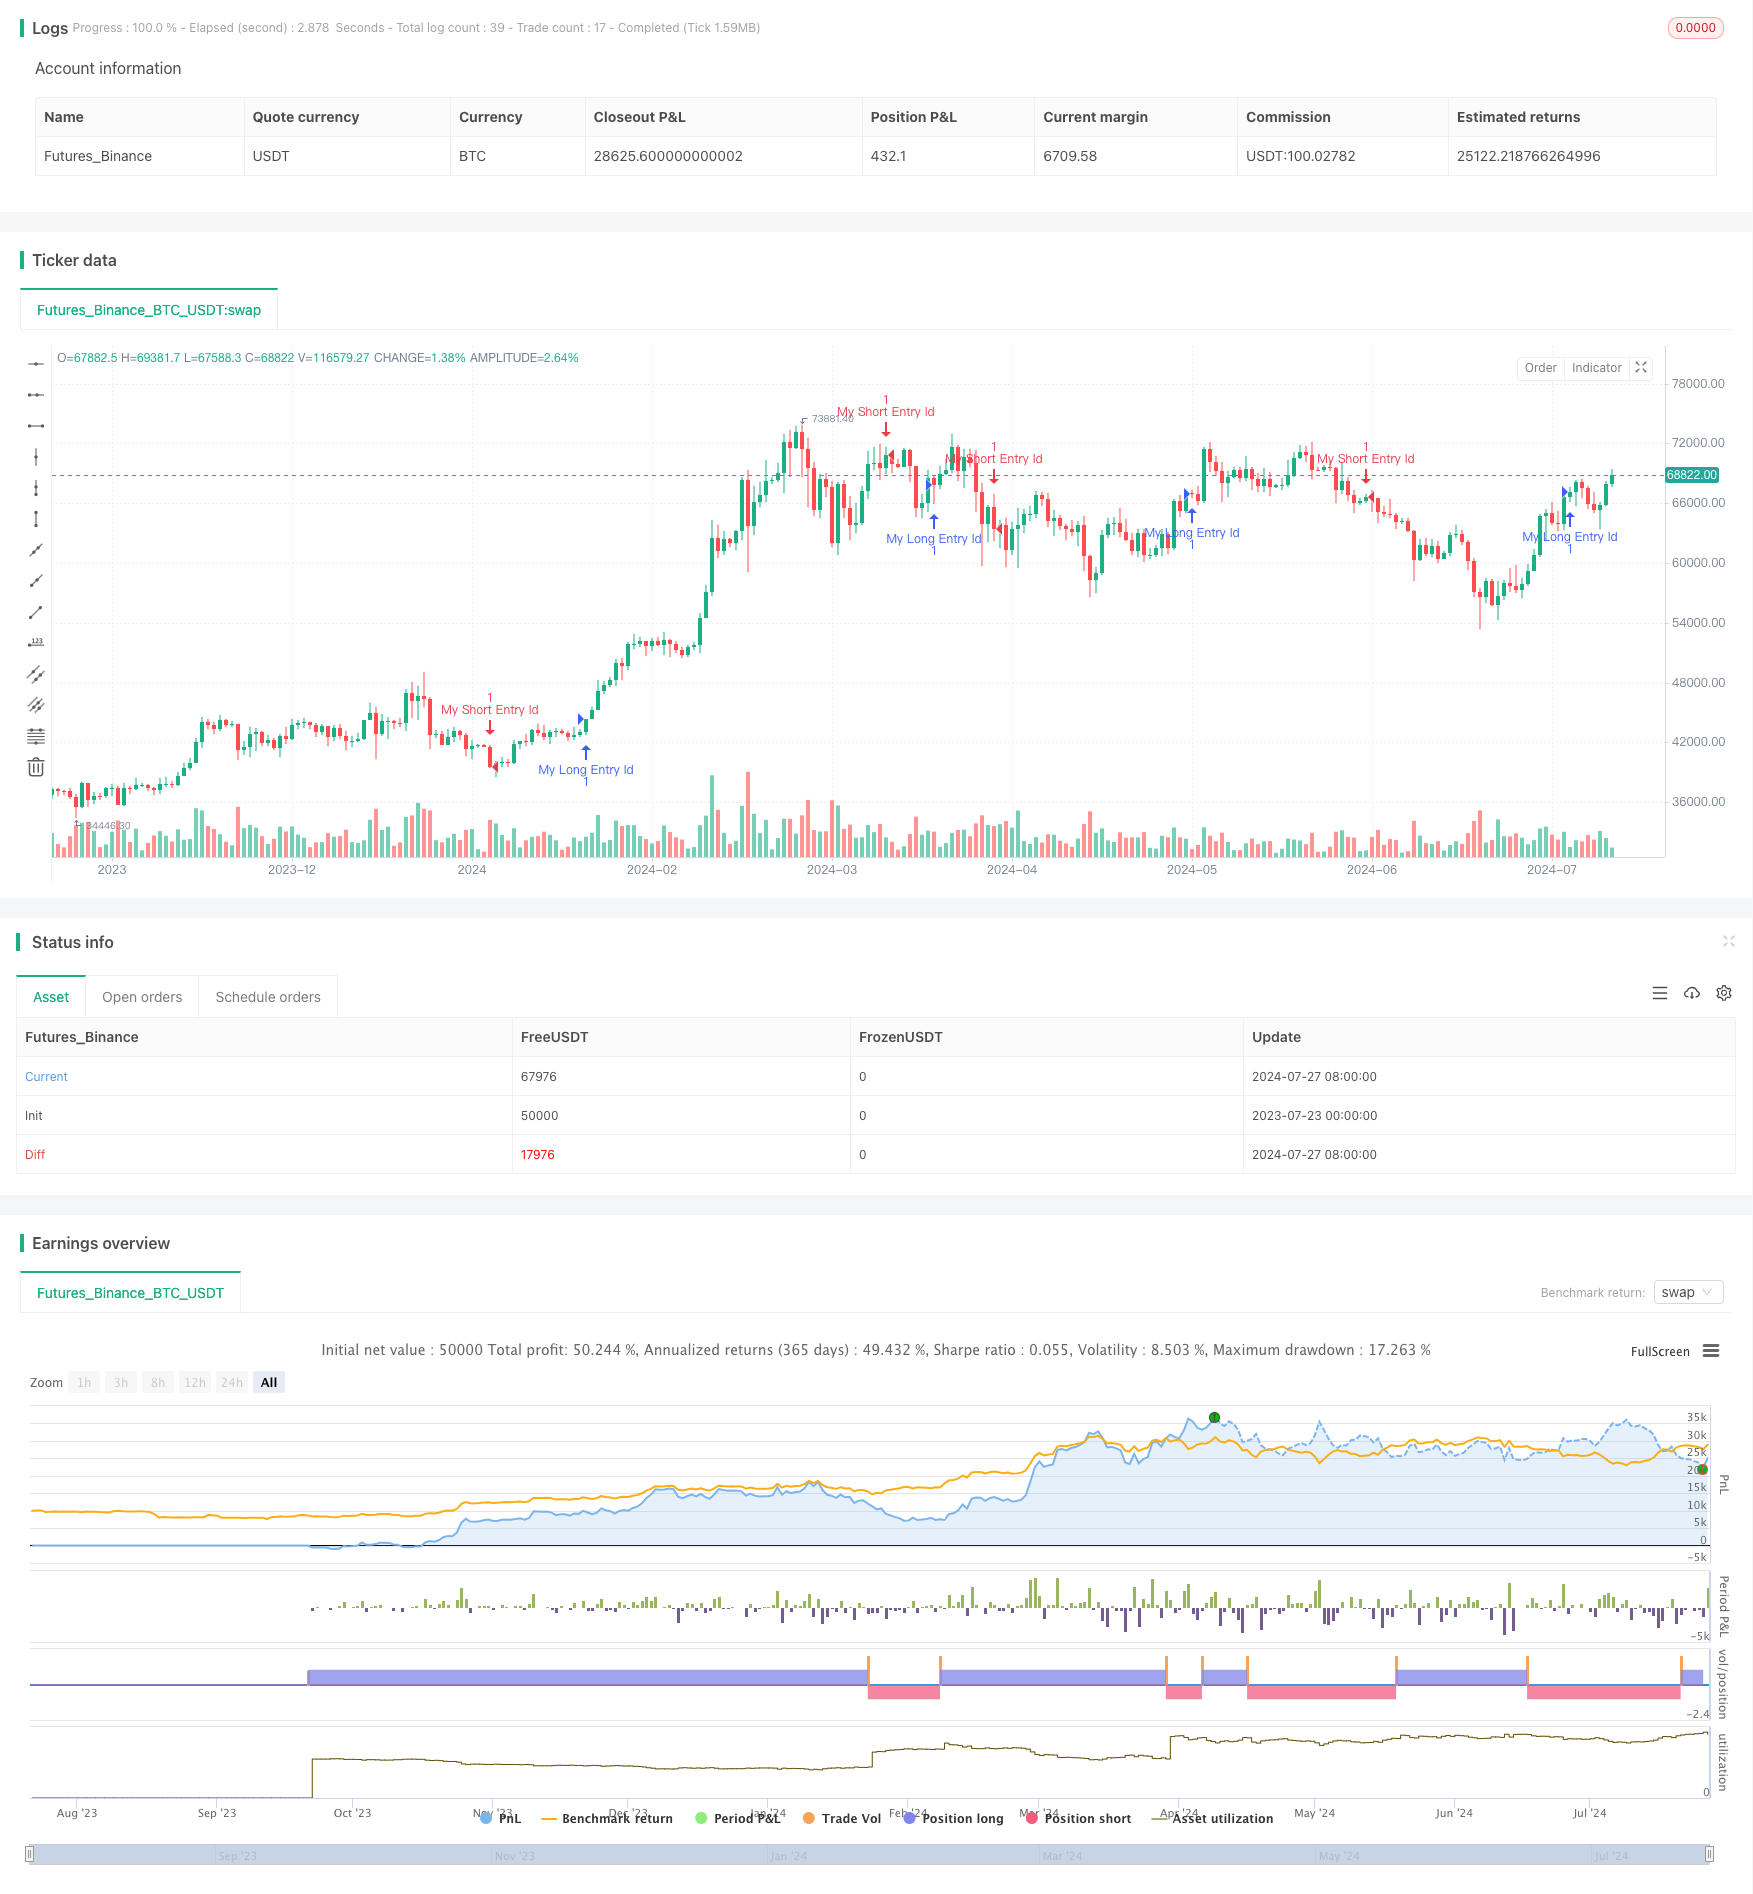
概要
この戦略は,SMAの交差信号とピークの引き戻し制御を組み合わせた多空取引システムである.14期と28期のSMAの交差を使用して多空取引信号を生成し,戦略のピークの引き戻しをリアルタイムで監視する.引き戻しがデフォルトの値を超えると,戦略は自動的に取引を停止する.さらに,戦略には,詳細なピーク-バレー周期分析機能が含まれています.
戦略原則
トランジションシグナル生成:
- 14期SMAの上で28期SMAを穿ったとき,多信号が生成される。
- 14期SMAの下の28期SMAを突破すると空調信号が生じます.
ピークの撤回制御:
- 戦略の利権曲線をリアルタイムで追跡し,歴史上の最高点 (ピーク) を記録します.
- 現在の利権がピーク以下であるとき,撤回状態に入り,最低点を記録する.
- 計算した撤回比率は = (ピーク - 谷底) /ピーク * 100%。
- 戦略は,撤回比率が設定された最大撤回値を超えた場合,新規ポジションの開設を停止します.
ピーク・バディ・サイクル分析:
- 効果的ピーク-バドーム周期を定義するために最小の撤回比率を設定します.
- 有効なサイクルが完了するたびに,サイクル番号,以前の上昇幅,撤回幅,終了時間を記録する.
- 分析結果を表の形式で表示し,トレーダーが戦略の過去のパフォーマンスを参照できるようにする.
戦略的優位性
トレンド追跡とリスク管理を組み合わせて: SMA交差策略は,典型的なトレンド追跡方法であり,ピーク・リトラクション・コントロールは,リスク管理の追加レベルを提供します.この組み合わせは,市場トレンドを捉えながら,下行リスクを効果的に制御できます.
適応力がある: 最大引き戻し値と最小引き戻し値のパラメータ設定により,戦略は異なる市場環境と個人リスクの好みに応じて柔軟に調整できます.
透明性の高いリスク指標: ピーク・バレー・サイクル分析は,詳細な歴史的撤回情報を提供し,トレーダーに戦略のリスク特性を直感的に理解させ,より賢明な取引意思決定を促します.
自動化されたリスク管理: 撤回が既定の値を超えると,戦略は自動的に取引を停止する.このメカニズムは,不利な市場環境で継続的な損失を防止するのに有効である.
総合的な業績分析: 従来の反測指標に加えて,戦略は詳細なピーク・バドームサイクルデータを提供しており,上昇幅,撤回幅,時間情報を含んで,戦略のパフォーマンスを深く分析するのに役立ちます.
戦略リスク
過去のデータへの過度な依存: SMA交差策略は,歴史的な価格データに基づいており,急速に変化する市場で遅滞して反応し,誤ったシグナルをもたらします.
取引頻度: 変動する市場では,SMAは頻繁に交差し,過剰な取引と高額な取引コストを引き起こす可能性があります.
韓国では, 市場が急激に波動する時には,最大回落のコントロールがあるにもかかわらず,単一の大落下は大きな損失を引き起こす可能性があります.
パラメータ感度: 戦略の性能はSMA周期と撤回値の選択に強く依存し,不適切なパラメータ設定は,次優位結果につながる可能性があります.
転機を逃した: 最大撤回値に達すると取引を停止し,市場逆転がもたらす機会を逃してしまう可能性があります.
戦略最適化の方向性
ダイナミックパラメータの調整を導入します. 市場変動の動向に応じてSMAサイクルと撤回値の調整を考慮して,異なる市場環境に対応することができる.
市場フィルターを追加する: RSIや取引量などの他の技術指標や基本的要因と組み合わせて,潜在的に偽の信号をフィルターします.
グループで入場と出場を可能にします. 倉庫全体ではなく,単一の決定のリスクを減らすために,倉庫の建設と保管を分量的に実現できます.
停止メカニズムに加入: 撤回制御の基礎に,利潤をロックし,全体的な収益率を向上させるために,動的な停止機能を追加する.
資金管理の最適化: アカウントの規模と市場の変動に基づくダイナミックなポジション管理を実現し,リスクをより良くコントロールする.
機械学習アルゴリズムを導入する: 機械学習技術を使用して,パラメータ選択とシグナル生成プロセスを最適化して,戦略の適応性と正確性を向上させる.
要約する
SMA交差多空策略は,ピークリートレードコントロールと自動終了を組み合わせた,トレンド追跡とリスク管理を兼ね備えた量化取引システムである.それは,単純な移動平均の交差によって市場のトレンドを捉え,同時にピークリートレードコントロールを利用して下行リスクを管理する.戦略のユニークな点は,詳細なピーク-バレー底周期分析機能であり,トレーダーに戦略のリスク特性を深く理解するためのツールを提供します.
戦略には,歴史的データやパラメータの過度に依存するなど,いくつかの固有のリスクがあるが,ダイナミックなパラメータの調整,追加の市場フィルターの追加,よりスマートな資金管理の実現などの適切な最適化や改善によって,その安定性と収益性を大幅に向上させることができる.
全体として,この戦略はトレーダーに良いスタート地点を提供し,その基礎をさらにカスタマイズし,個人の取引目標とリスクの好みに合わせて最適化することができます.戦略のモジュール化された設計は,他の取引戦略またはリスク管理技術と簡単に統合し,より複雑で総合的な取引システムを構築するための基礎を整えます.
/*backtest
start: 2023-07-23 00:00:00
end: 2024-07-28 00:00:00
period: 1d
basePeriod: 1h
exchanges: [{"eid":"Futures_Binance","currency":"BTC_USDT"}]
*/

// This Pine Script™ code is subject to the terms of the Mozilla Public License 2.0 at https://mozilla.org/MPL/2.0/

capital = 10000

//@version=5
strategy(title = "Correct Strategy Peak-Drawdown Cycles [Tradingwhale]", shorttitle = "Peak-Draw [Tradingwhale]", initial_capital = capital, overlay=true, margin_long=100, margin_short=100)

// The code below is from Tradingwhale LLC
/// ==============================================================================
//  Peak-Trough Cycles with Date and Prev. RunUp
// Initialize variables
showTable = input.bool(true, title = "Plot Peak to Bottom Drawdown Cycles table?")
min_trough = input.float(3.0, title = "Define Minimum Drawdown/Trough to Display (%)", minval = 1, maxval = 100, step = 0.5, tooltip = "Peaks and Trough Cycles have to be roped in by either a lookback period or minmimum troughs to show. If you don't then every bar could be a peak or trough/bottom. I've decided to use minimum declines here because lookback seems more arbitrary.")
maxdraw = input.float(40.0, title = "Max Drawdown", minval = 1, maxval = 100, step = 0.5, tooltip = "Define the drawdown level where the srtategy stops executing trades.")

var float equityPeak = na
var float equityTrough = na
var int cycleCount = 0
var bool inDrawdown = false
var float initialCapital = capital
var float prevTrough = initialCapital
var float prevRunUp = na
var bool useLighterGray = true
var int lastYear = na

// Variable to indicate whether the strategy should end
var bool end_strategy = false

// Table to display data
var table resultTable = table.new(position.top_right, 5, 30, bgcolor=#ffffff00, frame_color=#4f4040, frame_width=1)

// Function to convert float to percentage string
f_to_percent(value) =>
    str.tostring(value, "#.##") + "%"

// Function to get month/year string without commas
get_month_year_string() =>
    str.tostring(year) + "/" + str.tostring(month)

// Update the table headers
if (bar_index == 0 and showTable)
    table.cell(resultTable, 0, 0, "Show Min Trough: " + f_to_percent(min_trough), bgcolor=#a8a8a88f, text_size=size.normal)
    table.cell(resultTable, 1, 0, "Cycle Count", bgcolor=#a8a8a88f, text_size=size.normal)
    table.cell(resultTable, 2, 0, "Prev.RunUp(%)", bgcolor=#a8a8a88f, text_size=size.normal)
    table.cell(resultTable, 3, 0, "Drawdown(%)", bgcolor=#a8a8a88f, text_size=size.normal)
    table.cell(resultTable, 4, 0, "Year/Month", bgcolor=#a8a8a88f, text_size=size.normal)

// Track peaks and troughs in equity
if (na(equityPeak) or strategy.equity > equityPeak)
    if (inDrawdown and strategy.equity > equityPeak and not na(equityTrough)) // Confirm end of drawdown cycle
        drawdownPercentage = (equityPeak - equityTrough) / equityPeak * 100
        if drawdownPercentage > min_trough
            cycleCount += 1
            prevRunUp := (equityPeak - prevTrough) / prevTrough * 100
            if cycleCount <= 20 and showTable
                currentYear = year
                if na(lastYear) or currentYear != lastYear
                    useLighterGray := not useLighterGray
                    lastYear := currentYear
                rowColor = useLighterGray ? color.new(color.gray, 80) : color.new(color.gray, 50)
                table.cell(resultTable, 1, cycleCount, str.tostring(cycleCount), bgcolor=rowColor, text_size=size.normal)
                table.cell(resultTable, 2, cycleCount, f_to_percent(prevRunUp), bgcolor=rowColor, text_size=size.normal)
                table.cell(resultTable, 3, cycleCount, f_to_percent(drawdownPercentage), bgcolor=rowColor, text_size=size.normal)
                table.cell(resultTable, 4, cycleCount, get_month_year_string(), bgcolor=rowColor, text_size=size.normal)
            prevTrough := equityTrough
    equityPeak := strategy.equity
    equityTrough := na
    inDrawdown := false
else if (strategy.equity < equityPeak)
    equityTrough := na(equityTrough) ? strategy.equity : math.min(equityTrough, strategy.equity)
    inDrawdown := true

// Calculate if the strategy should end
if not na(equityPeak) and not na(equityTrough)
    drawdownPercentage = (equityPeak - equityTrough) / equityPeak * 100
    if drawdownPercentage >= maxdraw
        end_strategy := true


// This code below is from Tradingview, but with additions where commented (see below)

longCondition = ta.crossover(ta.sma(close, 14), ta.sma(close, 28))
if (longCondition) and not end_strategy // Add 'and not end_strategy' to your order conditions to automatically end the strategy if max_draw is exceeded/
    strategy.entry("My Long Entry Id", strategy.long)

shortCondition = ta.crossunder(ta.sma(close, 14), ta.sma(close, 28))
if (shortCondition) and not end_strategy // Add 'and not end_strategy' to your order conditions to automatically end the strategy if max_draw is exceeded/
    strategy.entry("My Short Entry Id", strategy.short)