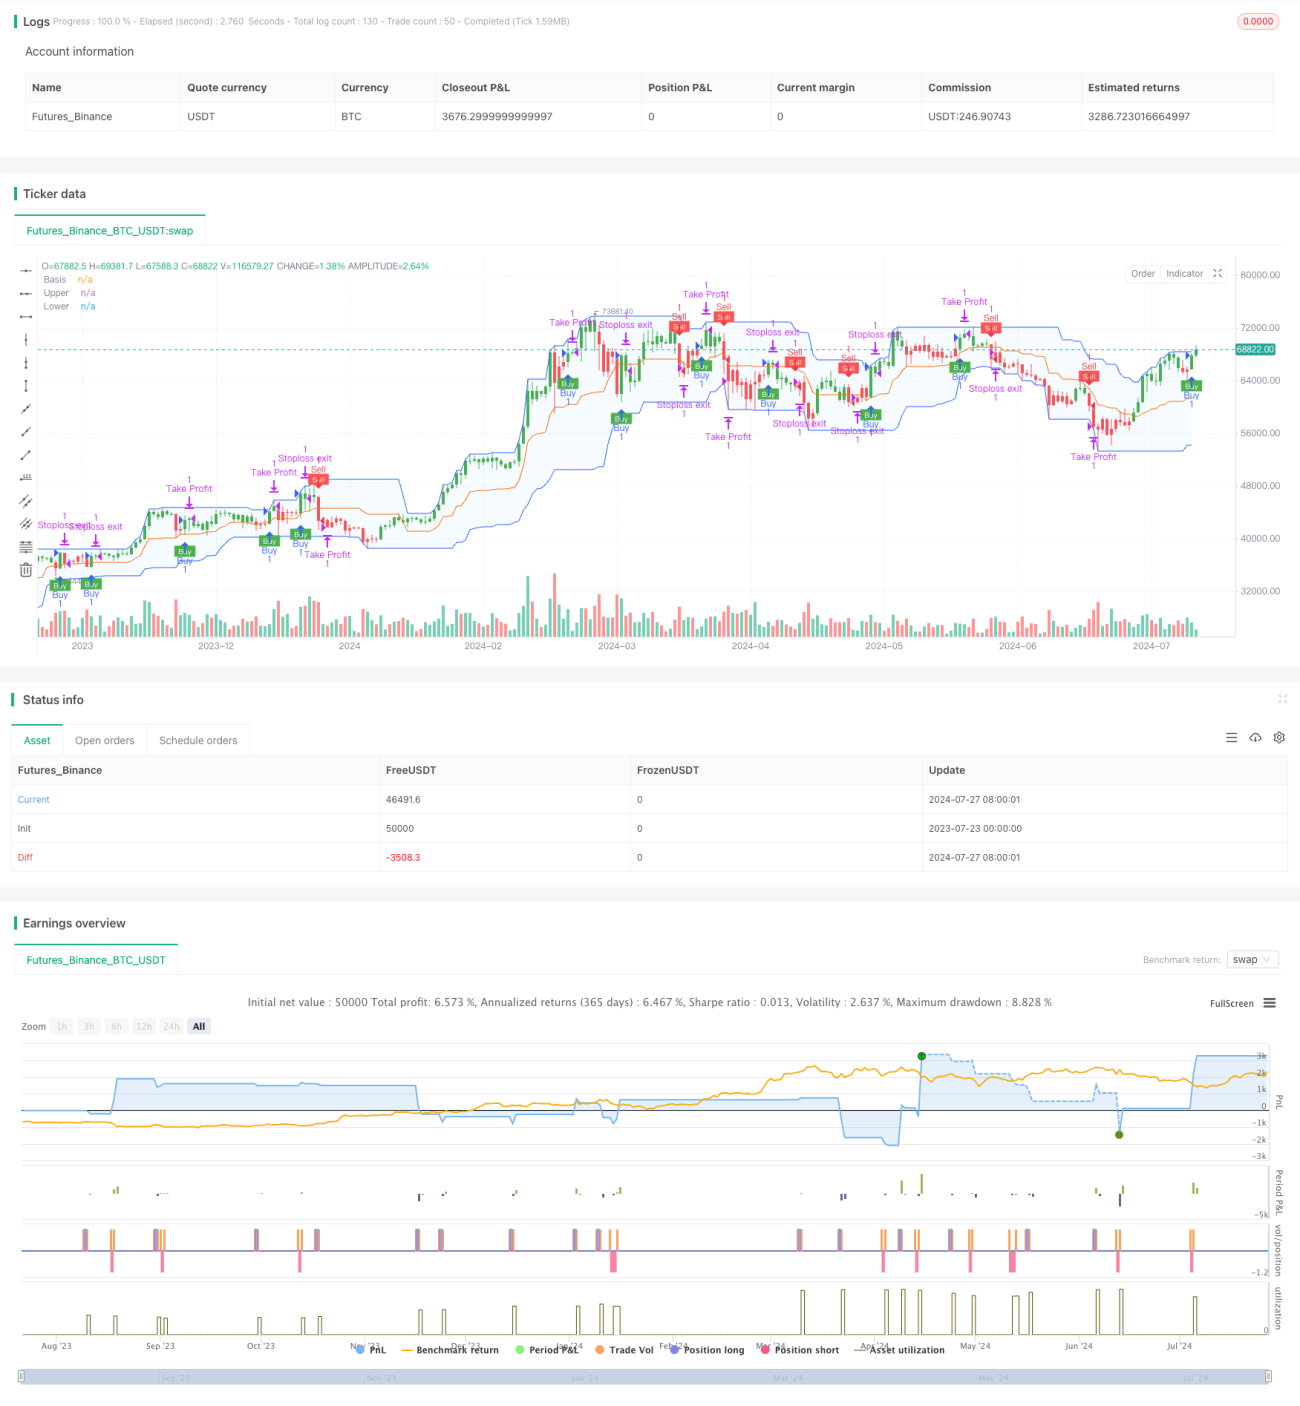
複数の指標の融合に基づく適応型トレンド追跡戦略

ATR RSI UT EMA DC
作成日: 2024-07-29 15:51:54 最終変更日: 2024-07-29 15:51:54
コピー: 1 クリック数: 498
1
フォロー
1617
フォロワー

複数の指標の融合に基づく適応型トレンド追跡戦略

概要

これは,複数の技術指標を組み合わせた自己適応的なトレンド追跡戦略である.この戦略は,UT Bot警報システム,相対的に強い指標 (RSI) フィルター,重描画されていないATR追跡ストップとドンチアンチャネル (Donchian Channel) を融合している.この戦略は,15分間の時間枠を採用し,ウィーキン・アシ (Heikin Ashi) 図を用いて信号の正確性を向上させ,パーセントに基づいた退出目標を設定している.

この戦略の核心は,多指標の協調によって市場動向を識別し,追跡することであり,同時に,柔軟なリスク管理機構を提供することです. より包括的で健全な取引意思決定を実現するために,動力 (RSI),波動性 (ATR),傾向 (唐津通路) など,多次元的な市場情報を組み合わせています.

戦略原則

  1. ATRトラッキングストップ:平均リアル波幅 ((ATR) を利用してダイナミックストップレベルを計算し,自主的なリスクコントロールを提供します.

  2. RSIフィルター:比較的強い指標 ((RSI) を使用してトレンドの方向を確認し,入場信号の信頼性を向上させる.

  3. トンチアン・チャネル: 市場全体の方向性を特定するための,トレンド確認の追加ツールとして

  4. 応募条件:

    • 多頭:価格がATR追跡ストップラインを横断し,RSIが50以上で,価格が唐津通路の中線より高い.
    • 空頭:価格がATRのストップラインを横断し,RSIが50未満で,価格が唐津通路の中線より低い.
  5. 退出メカニズム: 利益目標と Stop Loss レベルをパーセントで設定する.

  6. 選択可能なウィーキング-アヒルトグラフ: 価格データを平らにして偽信号を減らすために.

戦略的優位性

  1. 多次元分析:トレンド,動力,波動性指標を組み合わせて,市場に関する包括的な洞察を提供する.

  2. 適応性強:ATRトラッキングストップは,市場の変動に応じて自動的に調整し,異なる市場環境に対応します.

  3. リスク管理の完善:明瞭な止損と利益の目標,効果的なリスク管理.

  4. 信号品質の向上:RSIと唐通路の二重確認により,偽信号の減少.

  5. 柔軟性:異なる取引スタイルに適応するために,ウィキン・アシフチャートを使用することができます.

  6. 転写しない:ATRのトラッキング停止計算は,信号の信頼性と一致性を保証する.

戦略リスク

  1. 振動市場:横盤や振動市場では頻繁に偽信号が生じることがあります.

  2. 遅延: 複数の認証メカニズムにより,入学時間が少し遅れる可能性があります.

  3. 過剰最適化のリスク: 参数が多いため,過去データに過度に適合することが容易である.

  4. 市場環境への依存: 急速な市場変動に反応しなくなる可能性

  5. 実行滑り点: 高い波動性のある市場において,パーセントに基づく脱退は実行の課題となる可能性がある.

戦略最適化の方向性

  1. 動的パラメータ調整:鍵パラメータの自動最適化 (RSI 値,ATR 倍数など) を実現する.

  2. 市場レジム識別:異なる市場状態 (トレンド,揺れ) の判断を高め,動的調整戦略を策定する.

  3. タイムフレームの協調性:複数のタイムフレームの信号を組み合わせて,意思決定の安定性を向上させる.

  4. 波動率フィルター:非常に低い波動率の環境で取引を一時停止し,無効信号を避ける.

  5. 退出の強化:トレーリングストップや時間ベースの退出ルールを導入し,利益管理を最適化

  6. 取引量分析:取引量指標を組み合わせ,トレンドの強さをさらに確認する.

  7. 機械学習統合:機械学習アルゴリズムを使用してパラメータ選択と信号生成を最適化する.

要約する

この多指標融合の自己適応トレンドトラッキング戦略は,量化取引における体系化と多次元分析の優位性を示している.ATR,RSI,UT Bot,唐津通路などの複数の指標を統合することにより,戦略は,市場動態をさまざまな角度から捉え,比較的全面的で安定した取引信号を提供することができる.その自己適応特性と完善したリスク管理機構は,その良好な適応性と安定性を有している.

しかし,戦略の複雑さは,過度に適合し,パラメータの感受性などの潜在的なリスクももたらします.将来の最適化の方向は,戦略の適応性や強性を高めること,例えば,ダイナミックなパラメータの調整,市場状態の認識などの高度な機能を導入することに焦点を当てなければなりません.同時に,戦略の簡潔さと説明可能性を維持し,過度に複雑性の原因による安定性の低下を避けるように注意する必要があります.

全体として,この戦略は,トレンド追跡のための包括的で洞察力のある枠組みを提供し,継続的な最適化と慎重な適用によって,効果的な取引ツールになる可能性を秘めています.

ストラテジーソースコード
/*backtest
start: 2023-07-23 00:00:00
end: 2024-07-28 00:00:00
period: 1d
basePeriod: 1h
exchanges: [{"eid":"Futures_Binance","currency":"BTC_USDT"}]
*/

//@version=5
strategy("UT Bot Alerts - Non-Repainting with RSI Filter and Donchian Channels", overlay=true)

// Inputs for UT Bot
a = input.int(1, title="Key Value. 'This changes the sensitivity'")
c = input.int(10, title="ATR Period")
h = input.bool(false, title="Signals from Heikin Ashi Candles")
percentage = input.float(0.002, title="Percentage for Exit (0.2% as decimal)")

// RSI Inputs
rsiPeriod = input.int(14, title="RSI Period")
rsiSource = input.source(close, title="RSI Source")

// ATR Calculation
xATR = ta.atr(c)
nLoss = a * xATR

// Heikin Ashi Calculation
haClose = request.security(syminfo.tickerid, timeframe.period, close, lookahead=barmerge.lookahead_on)
haOpen = request.security(syminfo.tickerid, timeframe.period, open, lookahead=barmerge.lookahead_on)
haHigh = request.security(syminfo.tickerid, timeframe.period, high, lookahead=barmerge.lookahead_on)
haLow = request.security(syminfo.tickerid, timeframe.period, low, lookahead=barmerge.lookahead_on)
haCloseSeries = (haOpen + haHigh + haLow + haClose) / 4

src = h ? haCloseSeries : close

// RSI Calculation
rsiValue = ta.rsi(rsiSource, rsiPeriod)

// Non-repainting ATR Trailing Stop Calculation
var float xATRTrailingStop = na
if (barstate.isconfirmed)
    xATRTrailingStop := src > nz(xATRTrailingStop[1], 0) and src[1] > nz(xATRTrailingStop[1], 0) ? math.max(nz(xATRTrailingStop[1]), src - nLoss) : src < nz(xATRTrailingStop[1], 0) and src[1] < nz(xATRTrailingStop[1], 0) ? math.min(nz(xATRTrailingStop[1]), src + nLoss) : src > nz(xATRTrailingStop[1], 0) ? src - nLoss : src + nLoss

// Position Calculation
var int pos = 0
if (barstate.isconfirmed)
    pos := src[1] < nz(xATRTrailingStop[1], 0) and src > nz(xATRTrailingStop[1], 0) ? 1 : src[1] > nz(xATRTrailingStop[1], 0) and src < nz(xATRTrailingStop[1], 0) ? -1 : nz(pos[1], 0)

xcolor = pos == -1 ? color.red : pos == 1 ? color.green : color.blue

ema = ta.ema(src, 1)
above = ta.crossover(ema, xATRTrailingStop)
below = ta.crossover(xATRTrailingStop, ema)

// Track entry prices
var float entryPrice = na

// Donchian Channels
length = input.int(20, minval = 1, title="Donchian Channels Length")
offset = input.int(0, title="Donchian Channels Offset")
lower = ta.lowest(length)
upper = ta.highest(length)
basis = math.avg(upper, lower)
plot(basis, "Basis", color = #FF6D00, offset = offset)
u = plot(upper, "Upper", color = #2962FF, offset = offset)
l = plot(lower, "Lower", color = #2962FF, offset = offset)
fill(u, l, color = color.rgb(33, 150, 243, 95), title = "Background")

// Buy and sell conditions with RSI filter and basis condition
buy = src > xATRTrailingStop and above and barstate.isconfirmed and rsiValue > 50 and src > basis
sell = src < xATRTrailingStop and below and barstate.isconfirmed and rsiValue < 50 and src < basis

// Calculate target prices for exit
var float buyTarget = na
var float sellTarget = na

if (buy)
    entryPrice := src
    buyTarget := entryPrice * (1 + percentage)
    sellTarget := entryPrice * (1 - percentage)
    strategy.entry("Buy", strategy.long)

if (sell)
    entryPrice := src
    buyTarget := entryPrice * (1 + percentage)
    sellTarget := entryPrice * (1 - percentage)
    strategy.entry("Sell", strategy.short)

// Exit conditions
var bool buyExit = false
var bool sellExit = false
var bool stopLossExit = false

if (strategy.position_size > 0 and barstate.isconfirmed)
    if (src >= buyTarget)
        strategy.exit("Take Profit", "Buy", limit=buyTarget)
        buyExit := true
    if (src <= sellTarget)
        strategy.exit("Stoploss exit", "Buy", stop=src)
        stopLossExit := true

if (strategy.position_size < 0 and barstate.isconfirmed)
    if (src <= sellTarget)
        strategy.exit("Take Profit", "Sell", limit=sellTarget)
        sellExit := true
    if (src >= buyTarget)
        strategy.exit("Stoploss exit", "Sell", stop=src)
        stopLossExit := true

// Plotting
plotshape(buy, title="Buy", text='Buy', style=shape.labelup, location=location.belowbar, color=color.green, textcolor=color.white, size=size.tiny)
plotshape(sell, title="Sell", text='Sell', style=shape.labeldown, location=location.abovebar, color=color.red, textcolor=color.white, size=size.tiny)

barcolor(src > xATRTrailingStop ? color.green : na)
barcolor(src < xATRTrailingStop ? color.red : na)

alertcondition(buy, "UT Long", "UT Long")
alertcondition(sell, "UT Short", "UT Short")
alertcondition(buyExit, "UT Long Exit", "UT Long Exit")
alertcondition(sellExit, "UT Short Exit", "UT Short Exit")
alertcondition(stopLossExit, "Stoploss exit", "Stoploss exit")