動的なトレンド追跡と正確なストッププロフィットおよびストップロス戦略

EMA ATR TP SL
作成日: 2024-07-31 14:27:55 最終変更日: 2024-07-31 14:27:55
コピー: 10 クリック数: 968
1
フォロー
1617
フォロワー

動的なトレンド追跡と正確なストッププロフィットおよびストップロス戦略

概要

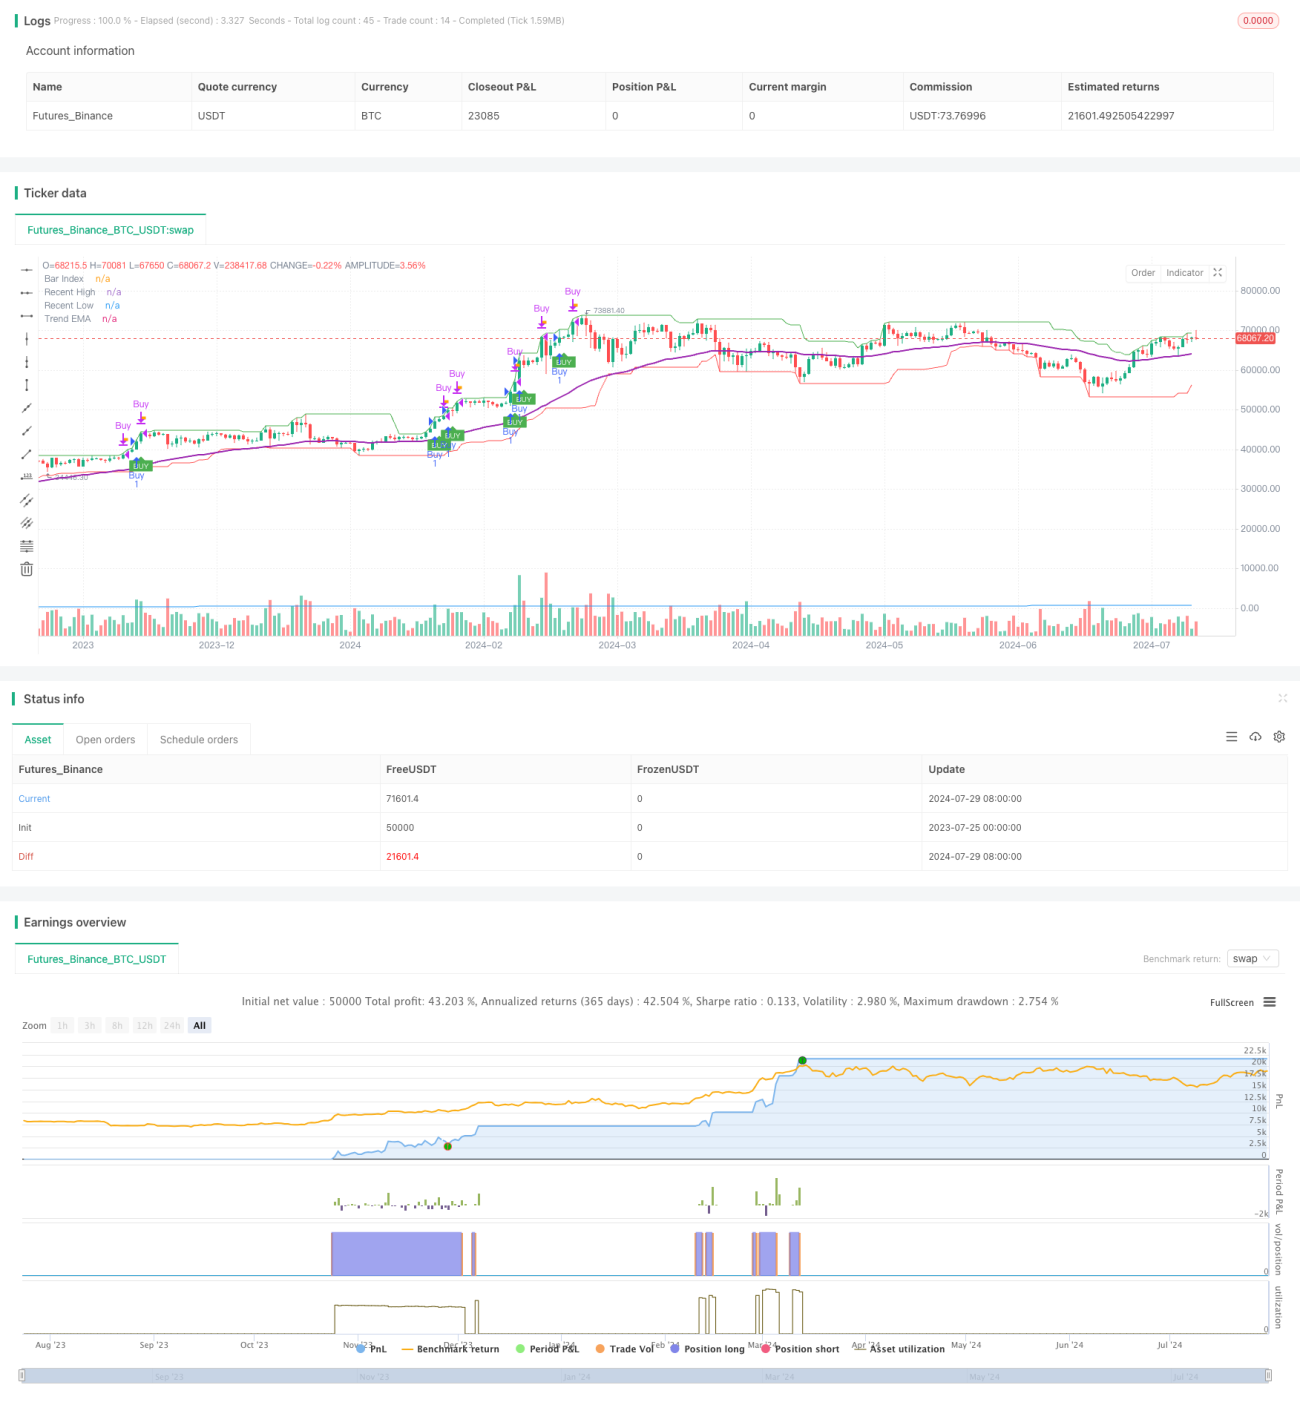
ダイナミック・トレンド・トラッキングと精密なストップ・ローズ戦略は,価格の動きとトレンドに基づく短期取引システムである.この戦略は,指数移動平均 (EMA) を動的トレンド・フィルターとして利用し,価格行動パターンと実際の波幅 (ATR) を組み合わせて,潜在的な取引機会を識別する.戦略の核心は,精密な入場信号生成機構と,動的に設定されたストップ (TP) とストップ (SL) レベルであり,利益の潜在能力を最大化し,リスクを効果的に制御することを目的としている.

戦略原則

  1. トレンド識別:50サイクルEMAを動的トレンドフィルターとして使用する. 価格がEMAの上位である場合にのみ多引を考慮する. 逆に空白を考慮する. これは,取引方向が全体的なトレンドと一致することを保証する.

  2. 入場シグナル: 策略は,連続した3つの線の価格行動を分析することによって入場タイミングを決定する.具体的には,以下のパターンを探す.

    • 多量化: 連続した3つの陽線で,それぞれの陽線の実体は前より大きいので,収束価格が上昇する.
    • 空:連続した3つの陰線で,それぞれの陰線の実体は前の陰線より大きいので,閉店価格は根が下がる.
  3. 波動性の確認: 波動性が充実しているときにのみ入場することを保証するために,実際の波幅 ((ATR) の変数を使用します. これは,市場があまりにも静かであるときに取引を避けるのに役立ちます.

  4. ダイナミックストップ:入場後,戦略は近年の高点 ((多) や低点 ((空) に基づいてストップ目標を設定する.この方法は,強いトレンドでより多くの利益を得ることを可能にします.

  5. 適応的ストップ:ストップポジションは,市場構造に合わせて動的保護を提供するために,最近の低点 ((多) や高点 ((空) に設定されます.

  6. リアルタイム実行: 戦略は,市場状況の評価を,各コネクタの閉店時に行い,最新の市場データに基づいて決定することを保証します.

戦略的優位性

  1. トレンドアライネーション: EMAフィルターにより,取引方向が主要トレンドと一致することを保証し,利益の確率を高めます.

  2. 正確な入場:厳しい入場条件 ((連続した価格動力と波動性の確認) は,偽信号を減らすのに役立ち,取引の質を向上させる.

  3. ダイナミックなリスク管理:自己適応のストップ・アンド・ストップ・スローメカニズムにより,戦略は市場構造に柔軟に適応し,資金を保護しながら,利益を早期に制限しない.

  4. 波動性の利用:ATRの変形によって,市場が十分な取引機会を提供しているときにのみ入場することを保証し,低波動期に過剰な取引を避ける.

  5. 複数の時間枠の適応性:戦略のパラメータは,異なる取引品種と時間枠に合わせて調整され,広範な応用可能性を提供します.

  6. ビジュアルフィードバック: 明確なグラフの標識 (買入シグナル,ストップとストップ・ロスのトリガーを含む) によって,トレーダーに直感的な市場洞察を提供します.

戦略リスク

  1. 偽の突破リスク:横断市場では,短期的な波動をトレンドの始まりと誤解し,不必要な取引を引き起こす可能性があります.

  2. スライドポイントの影響: 急速な動きのある市場では,実際の実行価格が,信号生成時の価格と有意に異なる可能性があります.

  3. 過剰取引: 波動性の高い期間に,戦略は過剰な信号を生成し,取引コストを増加させる可能性があります.

  4. トレンド反転の遅延:EMAに依存すると,トレンド反転の初期にチャンスを逃すか,不必要な損失を被る可能性があります.

  5. パラメータ感度: 戦略性能は,入力パラメータ (EMA周期,ATR倍数など) に非常に敏感であり,慎重に最適化する必要があります.

これらのリスクを軽減するために,以下の措置を考慮することができます.

  • 市場構造の分析を行い,真のブレイクと偽のブレイクを区別する.
  • 市場価格ではなく,制限価格のシートを使用して滑り点を制御します.
  • 過剰取引を防ぐために,冷却期または日々の取引制限を導入する.
  • トレンド指数と組み合わせて,トレンドの逆転への反応のスピードを高めます.
  • 徹底した反省と前向きなテストを行って,安定したパラメータ設定を見つけます.

戦略最適化の方向性

  1. 複数のタイムフレーム分析:より高いタイムフレームのトレンド情報を統合することで,入場決定の正確性を向上させることができます.例えば,日線EMAを追加のトレンドフィルターとして追加できます.

  2. トレンド認識の改善: より正確なトレンド認識を提供するために,より複雑なトレンド指標,例えば方向移動指数 (DMI) またはパラボリックSARを使用することを検討してください.

  3. ストップメカニズムの最適化:ストップを追跡し,強いトレンドでより長くポジションを保持することを可能にします. ストップのレベルを動的に調整するためにATRの倍数を使用することを考慮することができます.

  4. 入場条件の精細化:取引量確認または他の技術指標 (RSIやMACDなど) を加え,価格動力を検証し,偽信号を減らす.

  5. リスク管理の強化:口座規模に基づくポジション規模調整を実現し,各取引のリスクが一致することを保証する. 目標リスク・リターン比率を使用して取引決定を最適化することを考慮する.

  6. 市場環境の適応:市場環境の分類システムを開発し (例えば,傾向,範囲,高/低変動),異なる市場状況に応じて戦略パラメータを調整する.

  7. 機械学習の統合: パラメータの選択を最適化したり,最適なエントリー/アウトタイムを予測したりするために,戦略の適応性を高めるために,機械学習のアルゴリズムを使用する.

これらの最適化の方向は,戦略の安定性を高め,偽信号を減らす,そして異なる市場条件下でその有効性を維持することを目的としています.いかなる最適化も実施する際には,改善が実際にパフォーマンスの向上をもたらすことを確認するために,全面的なバックテストと前向きなテストが行われなければなりません.

要約する

動的トレンド追跡と精密なストップ・ストップ戦略は,トレンド追跡,動的取引と精密なリスク管理技術を組み合わせた精巧な短期取引システムである.この戦略は,EMAトレンドフィルター,厳格な入場条件,動的ストップ・ストップメカニズムを使用して,市場の短期的な動的機会を捉え,取引資金を過度のリスクから保護することを目的としています.

戦略の主要な優点は,市場構造への適応性と精密なリスク管理にあるため,さまざまな市場環境で安定したパフォーマンスを維持する可能性がある.しかし,すべての取引戦略と同様に,偽突破やパラメータ感受性などのいくつかの固有のリスクに直面している.

この戦略は,特にマルチタイムフレーム分析,高度なトレンド識別,機械学習の応用などにおいて,継続的な最適化と改善によって,その性能と適応性をさらに向上させる可能性がある.短期取引で機会把握とリスク管理のバランスを取ろうとするトレーダーにとって,この戦略は,堅固な基礎の枠組みを提供します.

最後に,すべての市場条件にぴったりの戦略が存在しないことを覚えておくことが重要です. 継続的なモニタリング,テスト,調整,そして個人のリスク承受能力と取引目標の深い理解が,成功するために必要なものです.

ストラテジーソースコード
/*backtest
start: 2023-07-25 00:00:00
end: 2024-07-30 00:00:00
period: 1d
basePeriod: 1h
exchanges: [{"eid":"Futures_Binance","currency":"BTC_USDT"}]
*/

//@version=5
strategy("Scalp Slayer (i)", overlay=true)

// Input Parameters
filterNumber = input.float(1.5, "Filter Number", minval=1.0, maxval=10.0, tooltip="Higher = More aggressive Filter, Lower = Less aggressive")
emaTrendPeriod = input.int(50, "EMA Trend Period", minval=1, tooltip="Period for the EMA used for trend filtering")
lookbackPeriod = input.int(20, "Lookback Period for Highs/Lows", minval=1, tooltip="Period for determining recent highs/lows")
colorTP = input.color(title='Take Profit Color', defval=color.orange)
colorSL = input.color(title='Stop Loss Color', defval=color.red)  // Added color for Stop Loss

// Inputs for visibility
showBuyLabels = input.bool(true, title="Show Buy Labels")
showSellLabels = input.bool(true, title="Show Sell Labels")
showStrategy = input.bool(true, title="Show Strategy", tooltip="Enable for strategy testing")

// Calculations
tr = high - low
ema = filterNumber * ta.ema(tr, 50)
trendEma = ta.ema(close, emaTrendPeriod)  // Calculate the EMA for the trend filter

// Ensure calculations are based on historical data only
recentHigh = ta.highest(high, lookbackPeriod)
recentLow = ta.lowest(low, lookbackPeriod)

// Variables to track the entry prices for profit target and stop-loss
var float entryPriceLong = na
var float entryPriceShort = na
var float targetPriceLong = na
var float targetPriceShort = na
var float stopLossLong = na
var float stopLossShort = na

// Buy and Sell Conditions with Trend Filter
buy = close > trendEma and  // Buy only if above the trend EMA
      close[2] > open[2] and close[1] > open[1] and close > open and 
      (math.abs(close[2] - open[2]) > math.abs(close[1] - open[1])) and 
      (math.abs(close - open) > math.abs(close[1] - open[1])) and 
      close > close[1] and close[1] > close[2] and tr > ema

sell = close < trendEma and  // Sell only if below the trend EMA
       close[2] < open[2] and close[1] < open[1] and close < open and 
       (math.abs(close[2] - open[2]) > math.abs(close[1] - open[1])) and 
       (math.abs(close - open) > math.abs(close[1] - open[1])) and 
       close < close[1] and close[1] < close[2] and tr > ema

// Entry Rules
if (buy and barstate.isconfirmed)  // Check for buy condition on candle close
    if (showStrategy)
        strategy.entry("Buy", strategy.long, comment="Buy at Close")
    entryPriceLong := close  // Track entry price for long position
    targetPriceLong := recentHigh  // Set take profit target to recent high
    stopLossLong := recentLow  // Set stop-loss to recent low

if (sell and barstate.isconfirmed)  // Check for sell condition on candle close
    if (showStrategy)
        strategy.entry("Sell", strategy.short, comment="Sell at Close")
    entryPriceShort := close  // Track entry price for short position
    targetPriceShort := recentLow  // Set take profit target to recent low
    stopLossShort := recentHigh  // Set stop-loss to recent high

// Take Profit and Stop Loss Logic
signalBuyTPPrint = (not na(entryPriceLong) and close >= targetPriceLong)
signalSellTPPrint = (not na(entryPriceShort) and close <= targetPriceShort)

signalBuySLPrint = (not na(entryPriceLong) and close <= stopLossLong)
signalSellSLPrint = (not na(entryPriceShort) and close >= stopLossShort)

if (signalBuyTPPrint)
    if (showStrategy)
        strategy.close("Buy", comment="Close Buy at Profit Target")
    entryPriceLong := na  // Reset entry price for long position
    targetPriceLong := na  // Reset target price for long position
    stopLossLong := na  // Reset stop-loss for long position

if (signalSellTPPrint)
    if (showStrategy)
        strategy.close("Sell", comment="Close Sell at Profit Target")
    entryPriceShort := na  // Reset entry price for short position
    targetPriceShort := na  // Reset target price for short position
    stopLossShort := na  // Reset stop-loss for short position

if (signalBuySLPrint)
    if (showStrategy)
        strategy.close("Buy", comment="Close Buy at Stop Loss")
    entryPriceLong := na  // Reset entry price for long position
    targetPriceLong := na  // Reset target price for long position
    stopLossLong := na  // Reset stop-loss for long position

if (signalSellSLPrint)
    if (showStrategy)
        strategy.close("Sell", comment="Close Sell at Stop Loss")
    entryPriceShort := na  // Reset entry price for short position
    targetPriceShort := na  // Reset target price for short position
    stopLossShort := na  // Reset stop-loss for short position

// Plot Buy and Sell Labels with Visibility Conditions
plotshape(showBuyLabels and buy, "Buy", shape.labelup, location=location.belowbar, color=color.green, text="BUY", textcolor=color.white, size=size.tiny, offset=1)
plotshape(showSellLabels and sell, "Sell", shape.labeldown, location=location.abovebar, color=color.red, text="SELL", textcolor=color.white, size=size.tiny, offset=1)

// Plot Take Profit Flags
plotshape(showBuyLabels and signalBuyTPPrint, title="Take Profit (buys)", text="TP", style=shape.flag, location=location.abovebar, color=colorTP, textcolor=color.white, size=size.tiny)
plotshape(showSellLabels and signalSellTPPrint, title="Take Profit (sells)", text="TP", style=shape.flag, location=location.belowbar, color=colorTP, textcolor=color.white, size=size.tiny)

// Plot Stop Loss "X" Marker
plotshape(showBuyLabels and signalBuySLPrint, title="Stop Loss (buys)", text="X", style=shape.xcross, location=location.belowbar, color=colorSL, textcolor=color.white, size=size.tiny)
plotshape(showSellLabels and signalSellSLPrint, title="Stop Loss (sells)", text="X", style=shape.xcross, location=location.abovebar, color=colorSL, textcolor=color.white, size=size.tiny)

// Plot Trend EMA for reference
plot(showStrategy ? trendEma : na, title="Trend EMA", color=color.purple, linewidth=2)

// Plot recent high and low for debugging and validation
plot(showStrategy ? recentHigh : na, title="Recent High", color=color.green, linewidth=1)
plot(showStrategy ? recentLow : na, title="Recent Low", color=color.red, linewidth=1)

// Debugging: Plot bar index to verify real-time behavior
plot(showStrategy ? bar_index : na, title="Bar Index", color=color.blue)

// Debugging: Print the take profit and stop loss conditions
//label.new(bar_index, high, text="TP Buy: " + tostring(signalBuyTPPrint) + "\nSL Buy: " + tostring(signalBuySLPrint) + "\nTP Sell: " + tostring(signalSellTPPrint) + "\nSL Sell: " + tostring(signalSellSLPrint), color=color.blue, textcolor=color.white, size=size.small, style=label.style_label_down)